I recently completed a project that demonstrates the power of modern big data technologies in cybersecurity as part of my coursework. The assignment was to build a complete intrusion detection system using the UNSW-NB15 dataset, employing Apache Hive for distributed query processing and Apache Spark with PySpark for machine learning.
Resources
For those interested in exploring this project further or implementing similar systems, I have made all resources publicly available:
- GitHub Repository: Big-Data-Analytics-CN-7031
- Dataset Download Link: UNSW-NB15.csv (581MB)
- Feature Documentation: UNSW-NB15_features.csv
Feel free to explore the repository and experiment with the code.
- The results exceeded my expectations: I achieved 99.07% accuracy for binary classification and 97.79% for multi-class classification across the attack categories. In this post, I will walk you through my approach, key findings, and the lessons learned along the way.
The Challenge: Analyzing 2.5 Million Network Flows
The UNSW-NB15 dataset contains approximately 2.5 million network flow records with 49 features extracted from raw network packets. Unlike older datasets, UNSW-NB15 includes modern attack vectors that reflect contemporary cybersecurity threats.
The dataset includes nine attack types: Fuzzers, Analysis, Backdoor, Denial of Service (DoS), Exploits, Generic, Reconnaissance, Shellcode, and Worms. Each attack type exhibits distinct behavioral patterns that machine learning models can learn to detect.
One of the first challenges I encountered was severe class imbalance. The dataset contains 87.35% normal traffic and only 12.65% attack traffic, mirroring real-world network conditions where attacks are relatively rare events. This imbalance required careful consideration in model evaluation, as simple accuracy metrics could be misleading.
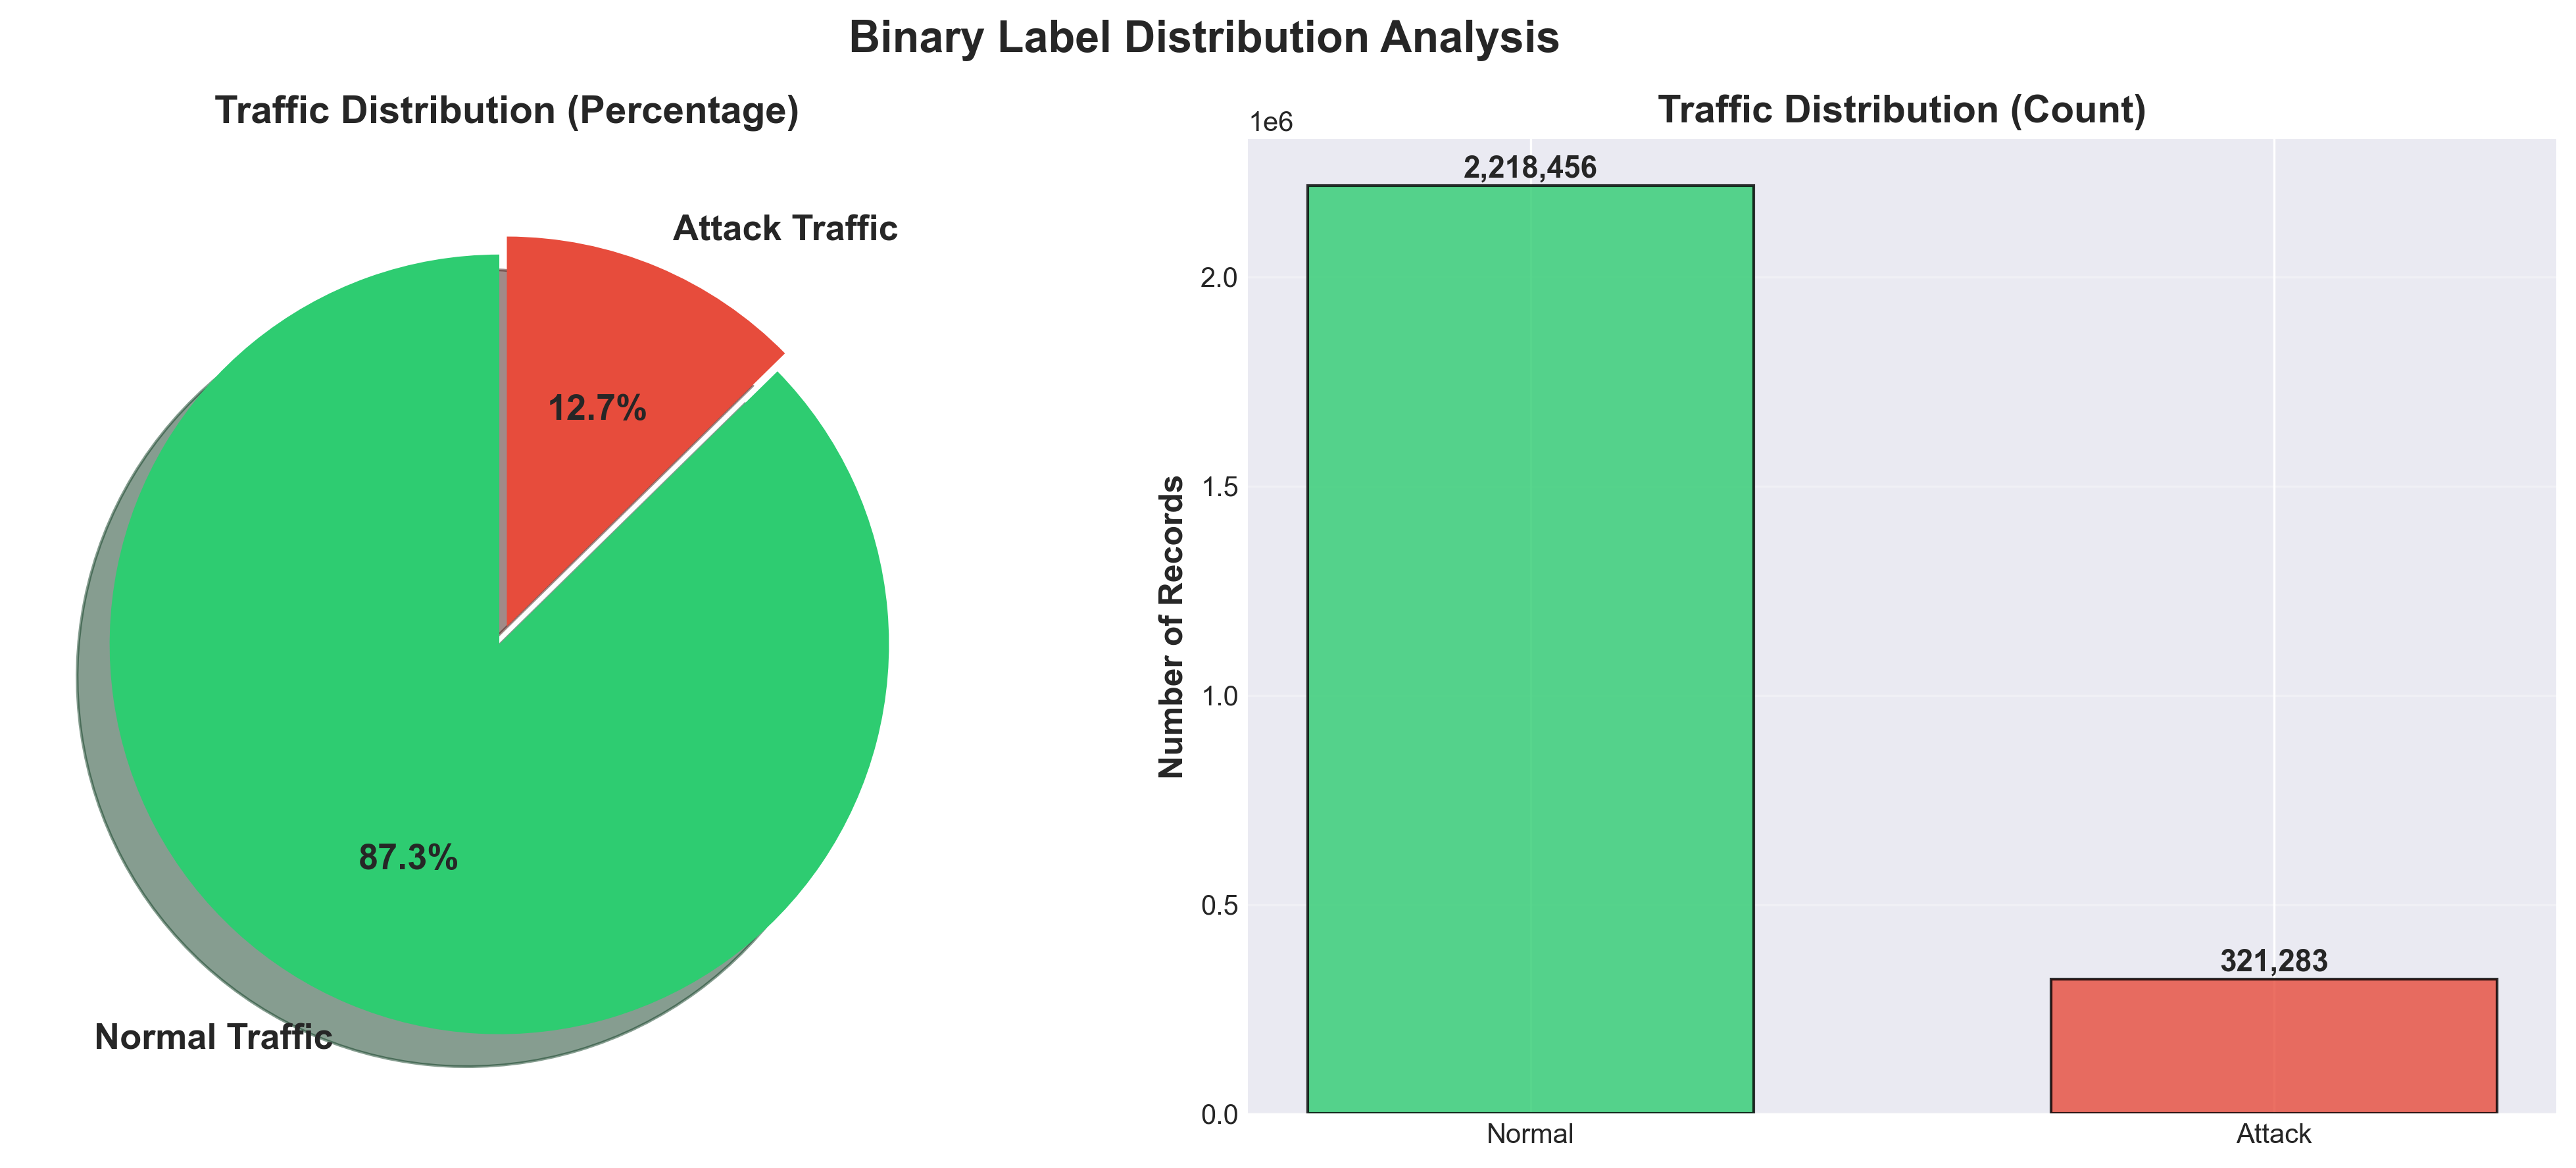
Dataset distribution showing the severe class imbalance between normal and attack traffic
Part One: Exploratory Analysis with Apache Hive
I began my analysis by developing SQL queries in Apache Hive to understand the dataset's characteristics. Hive's SQL-like interface made it accessible for exploratory analysis while leveraging Hadoop's distributed processing capabilities.
View the complete Hive visualization script: visualize_hive.py
Query 1: Attack Distribution Analysis
My first query employed CASE statements and aggregation functions to analyze traffic distribution across attack categories. I discovered that Generic attacks are the most prevalent with 215,481 instances, while Exploits demonstrate the longest average duration at 2.12 seconds.
SELECT
    CASE
        WHEN label = 0 THEN 'Normal'
        WHEN label = 1 THEN 'Attack'
        ELSE 'Unknown'
    END AS traffic_type,
    attack_cat,
    COUNT(*) as count,
    ROUND(AVG(dur), 4) as avg_duration,
    ROUND(AVG(sbytes), 2) as avg_src_bytes,
    ROUND(AVG(dbytes), 2) as avg_dst_bytes
FROM unsw_nb15
GROUP BY label, attack_cat
ORDER BY count DESC;
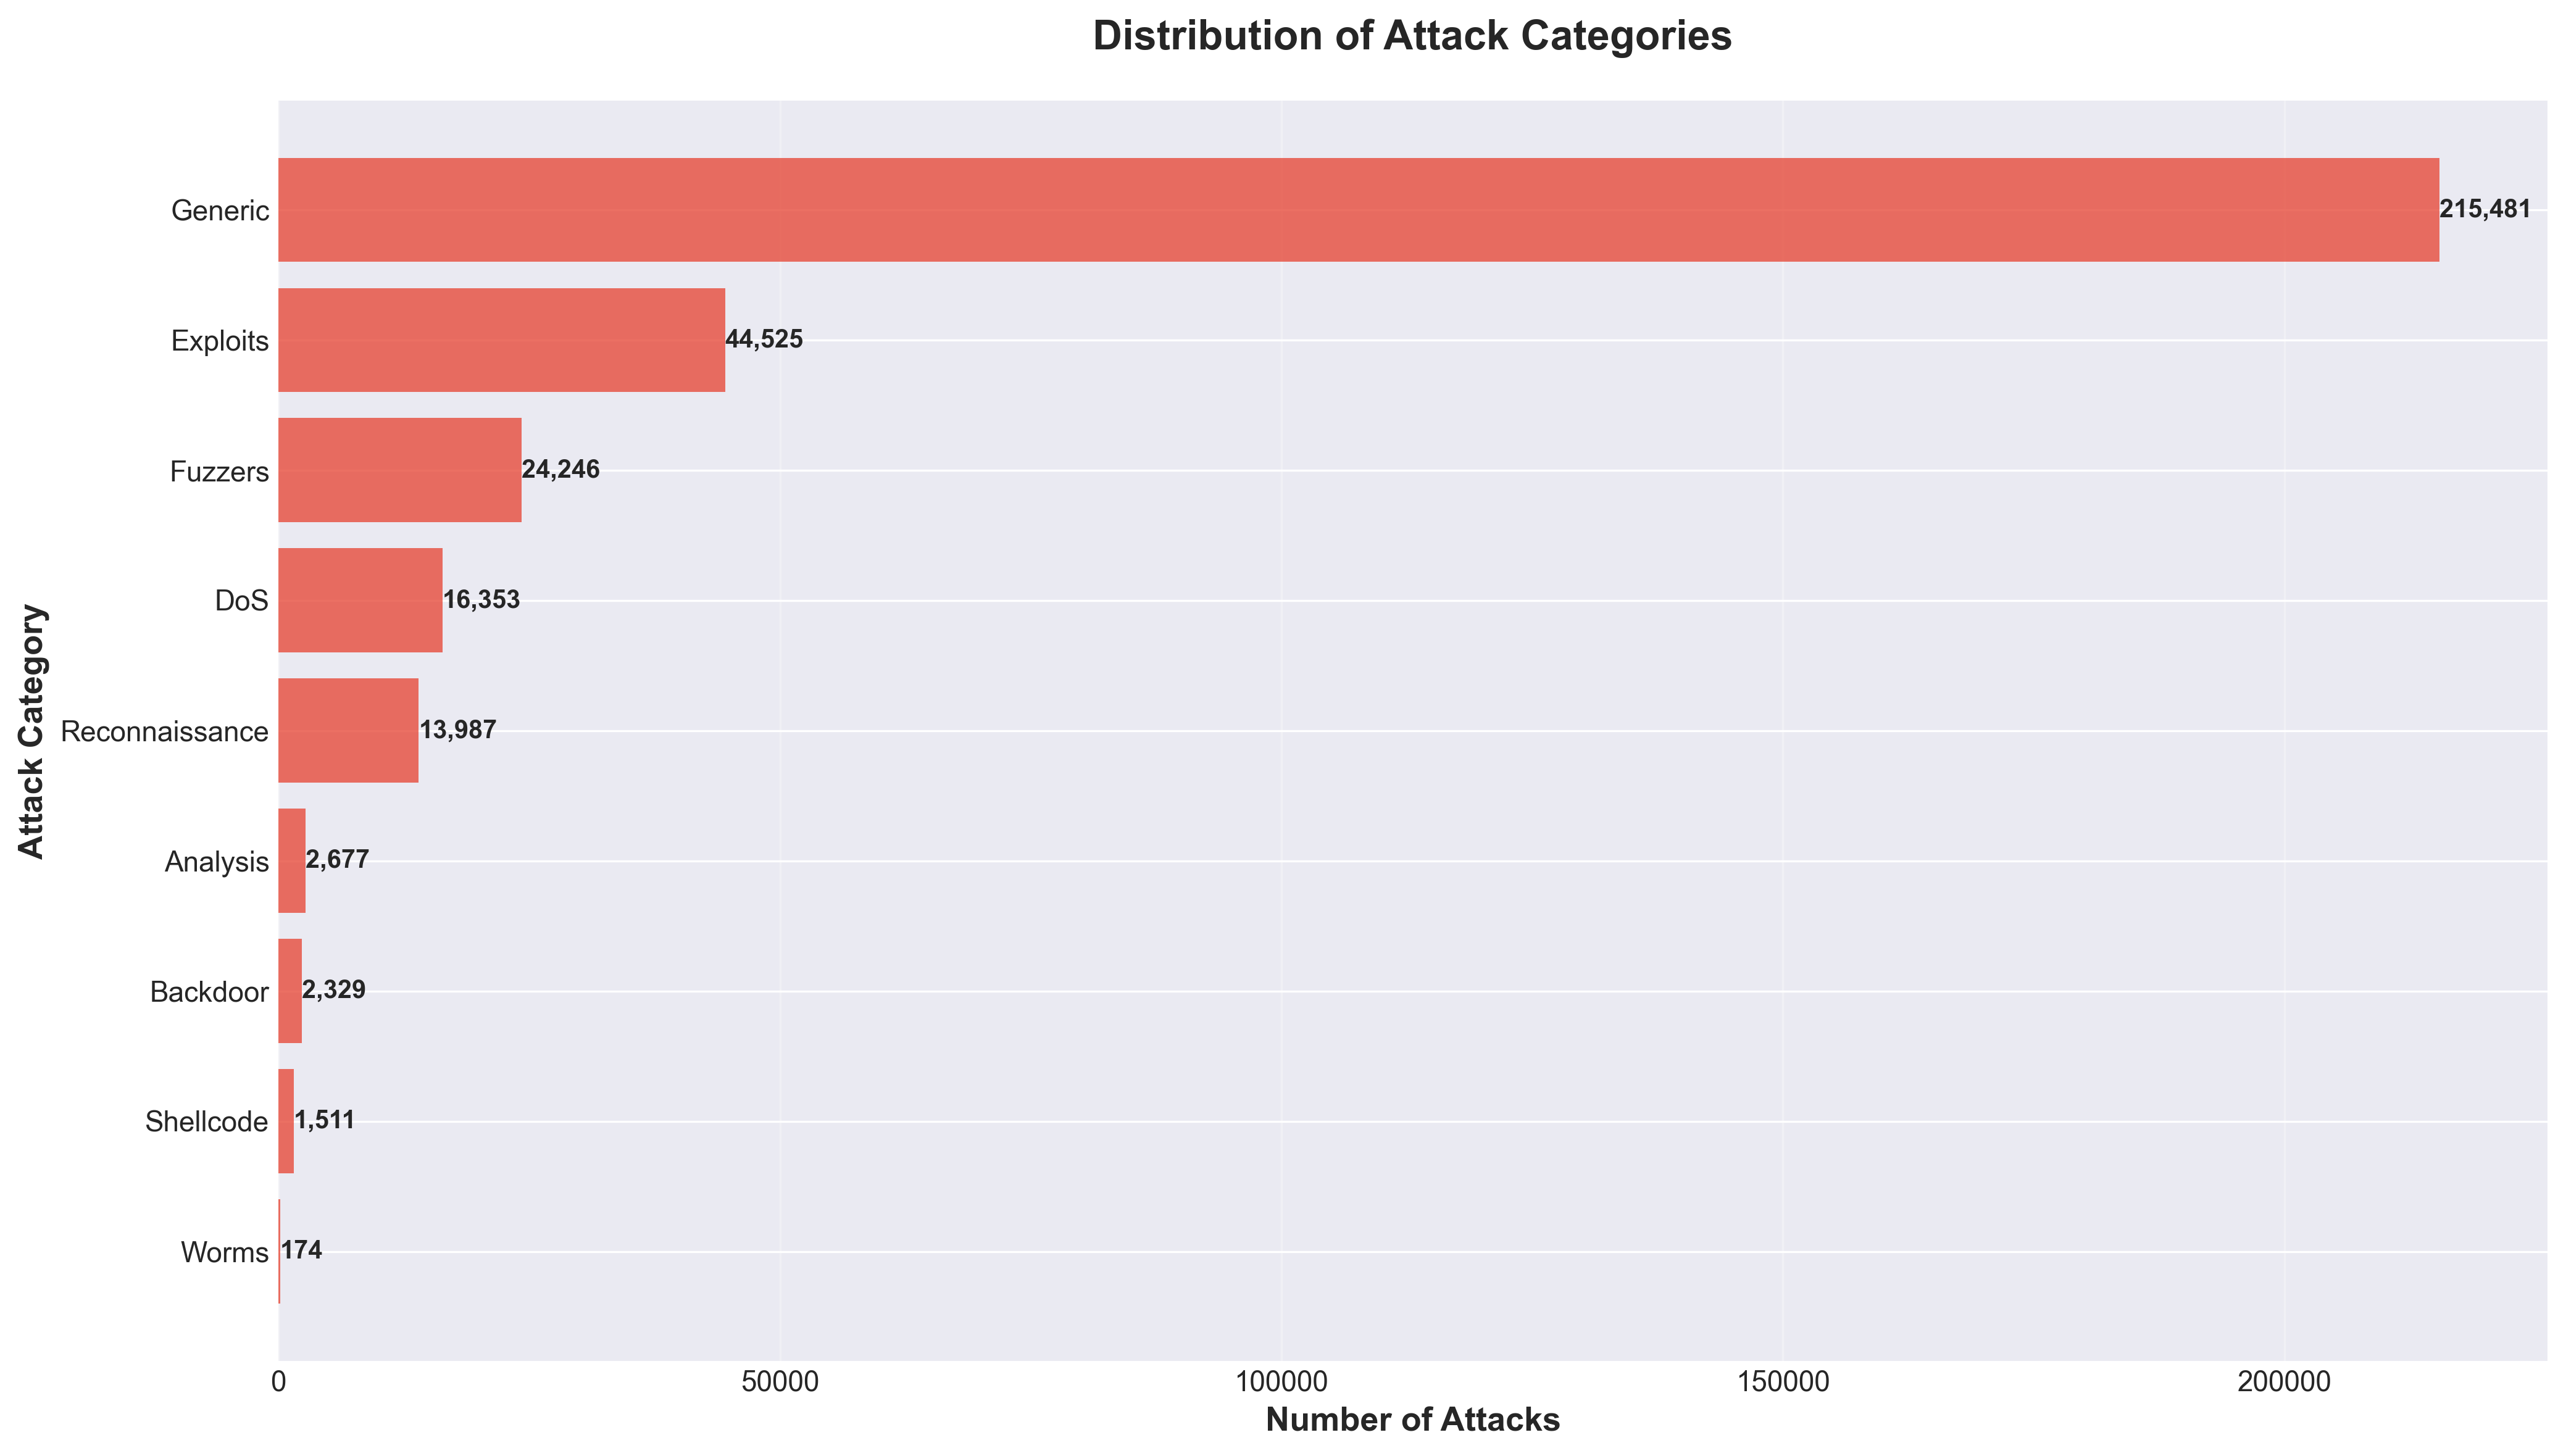
Distribution of attack instances across different categories
Query 2: Protocol Vulnerability Analysis
Using string functions and conditional aggregation, I identified critical protocol vulnerabilities that surprised me. SCTP and UNAS protocols exhibited 100% attack rates, while TCP/POP3 showed a 99.74% attack rate across 1,529 connections. This finding suggests severe security concerns for email protocols that organizations should address urgently.
SELECT
    UPPER(proto) as protocol,
    UPPER(service) as service_type,
    COUNT(*) as connection_count,
    SUM(CASE WHEN label = 1 THEN 1 ELSE 0 END) as attack_count,
    ROUND(SUM(CASE WHEN label = 1 THEN 1 ELSE 0 END) * 100.0 / COUNT(*), 2) as attack_percentage,
    ROUND(AVG(sbytes + dbytes), 2) as avg_total_bytes
FROM unsw_nb15
WHERE proto IS NOT NULL AND proto != '-'
GROUP BY UPPER(proto), UPPER(service)
HAVING connection_count > 1000
ORDER BY attack_percentage DESC
LIMIT 15;
Most concerning discovery: UDP/DNS service had 210,566 malicious connections representing a 26.94% attack rate. This highlights a major security concern for fundamental internet infrastructure that many organizations might overlook.
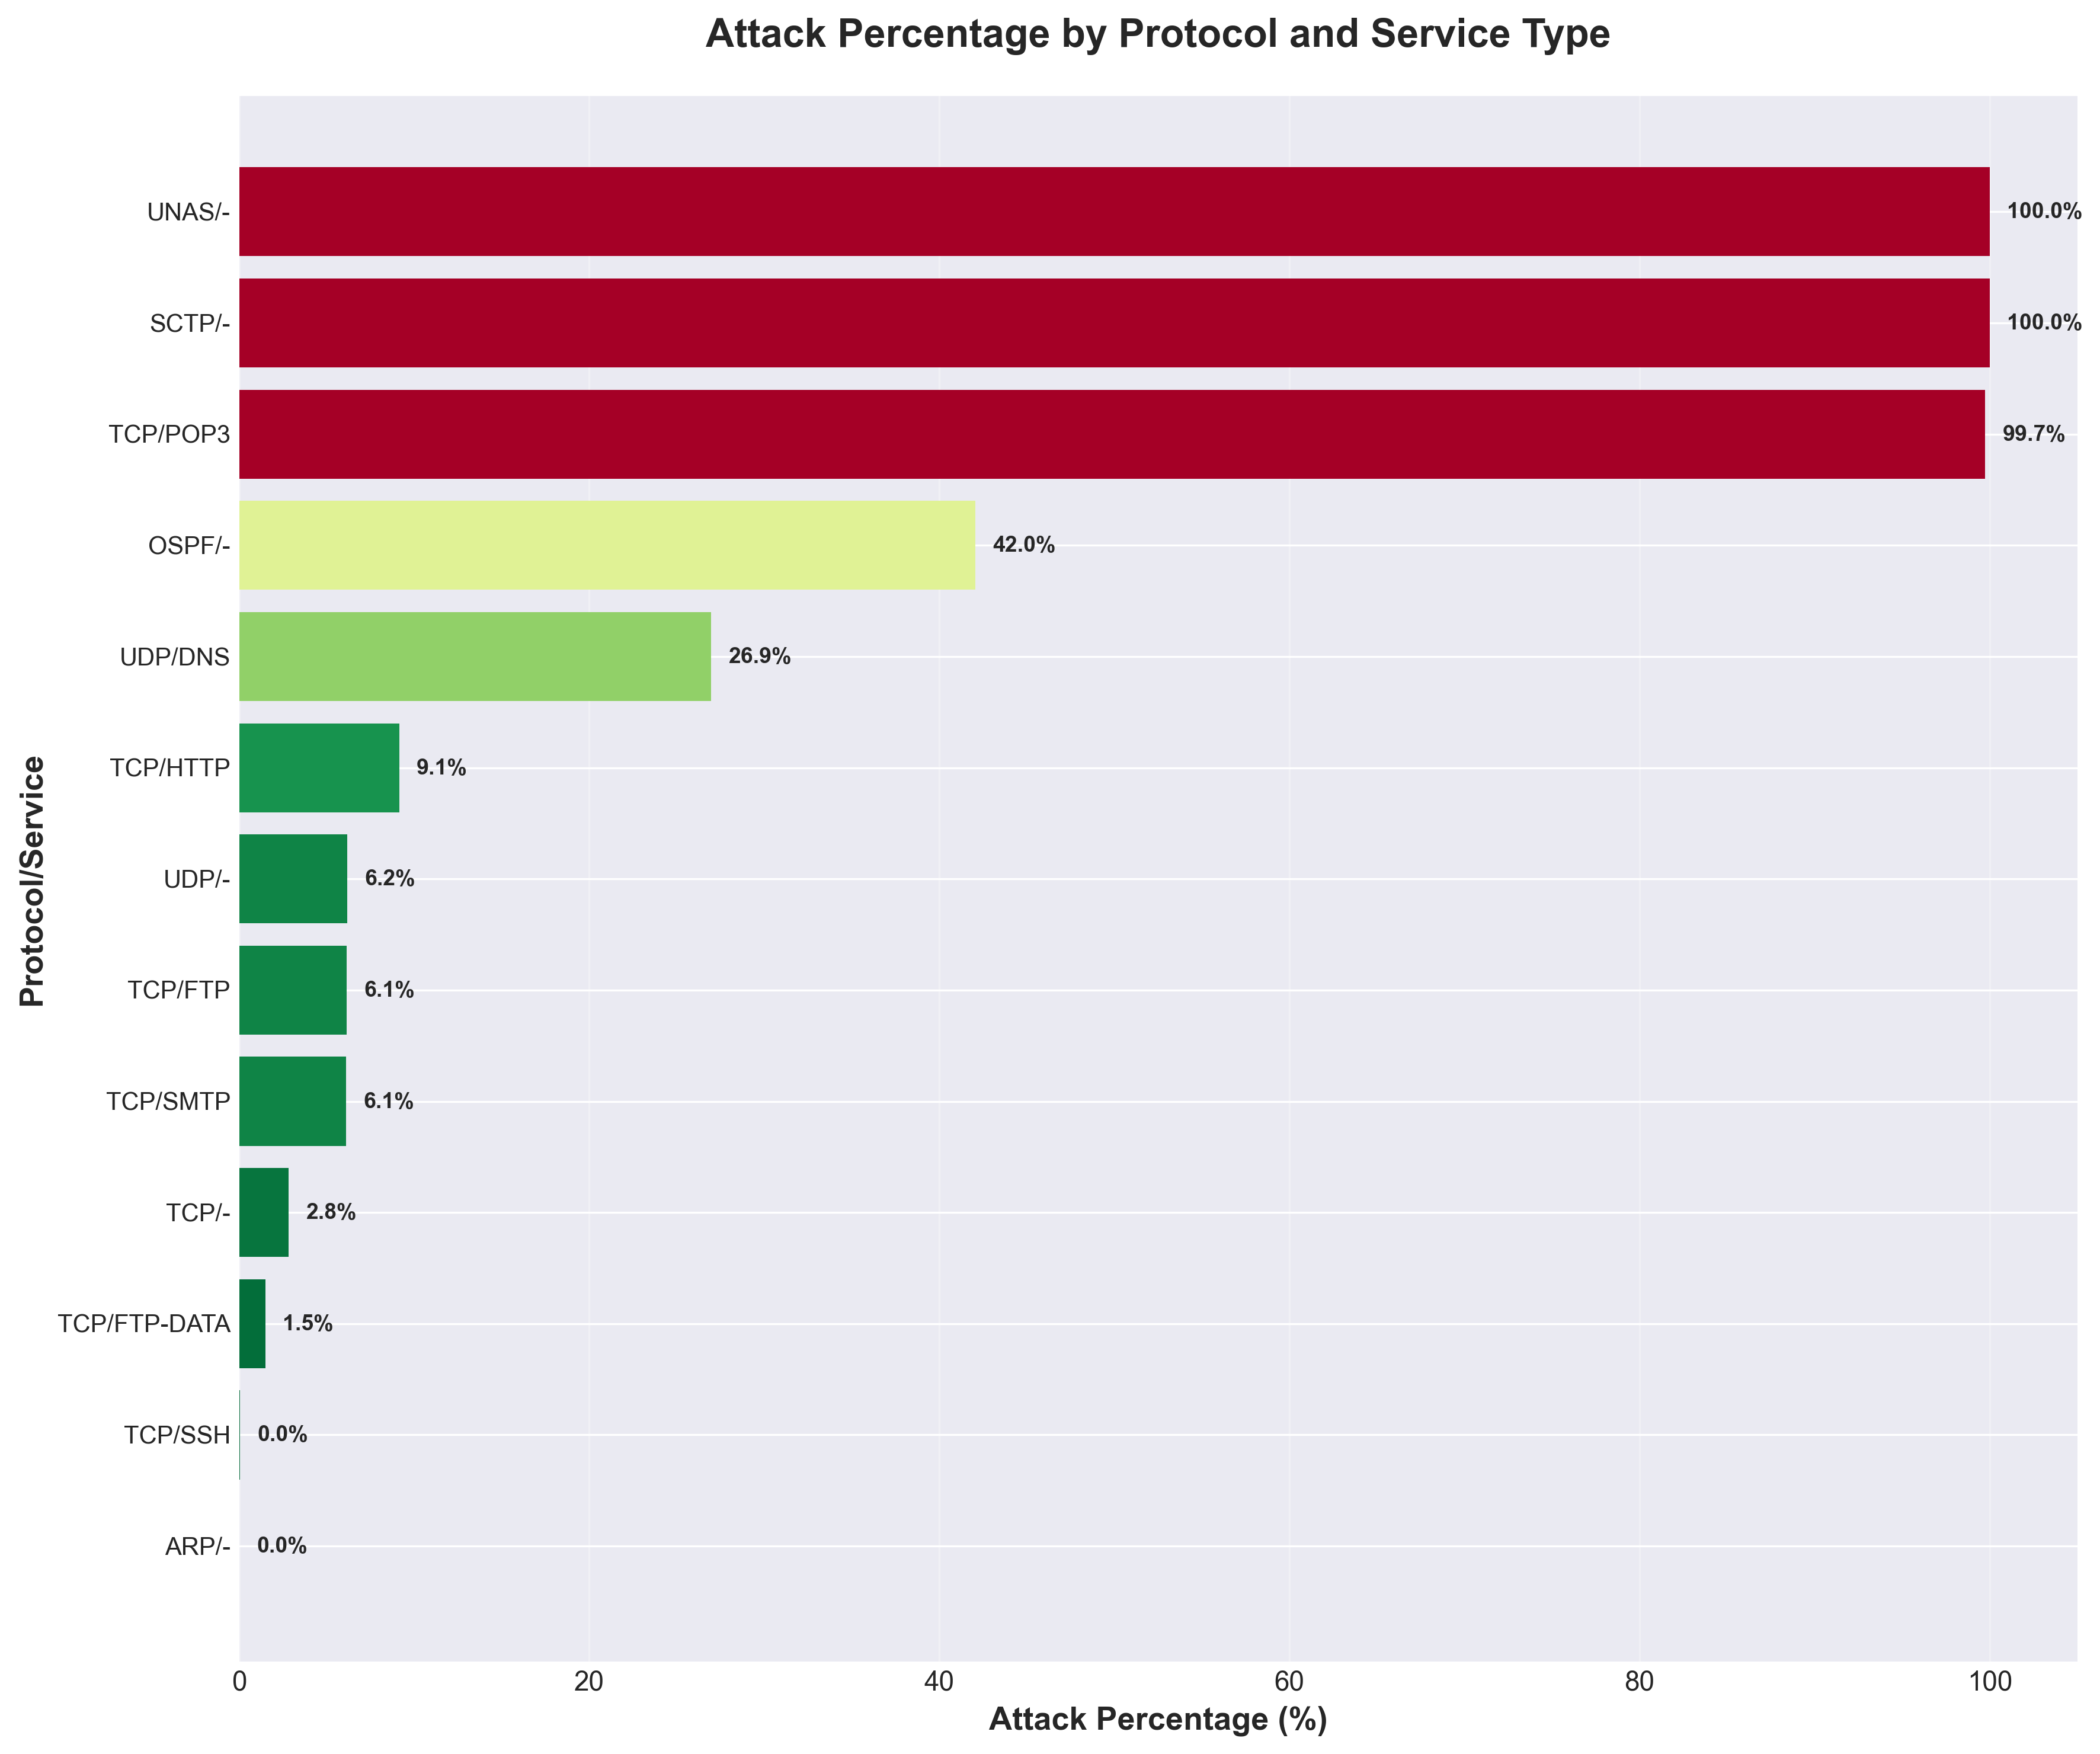
Attack percentages by protocol revealing critical vulnerabilities in network services
Query 3: Top Attack Categories Analysis
My third query focused on identifying the most prevalent attack types in the dataset. This analysis helped prioritize which attack vectors require the most attention from security teams.
SELECT
    attack_cat,
    COUNT(*) as attack_count,
    ROUND(AVG(dur), 4) as avg_duration,
    ROUND(AVG(sbytes), 2) as avg_src_bytes,
    ROUND(AVG(dbytes), 2) as avg_dst_bytes
FROM unsw_nb15
WHERE label = 1
GROUP BY attack_cat
ORDER BY attack_count DESC
LIMIT 10;
The results confirmed that Generic attacks dominate the threat landscape with 215,481 instances, followed by Exploits (44,525 instances) and Fuzzers (24,246 instances). This distribution emphasizes the importance of defending against common, automated attack patterns.
Query 4: Connection State Analysis
My fourth query utilized advanced statistical functions including STDDEV, PERCENTILE, MIN, and MAX to analyze traffic patterns across connection states. The results revealed that intermediate (INT) connection states are most vulnerable to attacks, with 260,620 malicious connections representing 53.14% of all INT state connections.
SELECT
    state,
    COUNT(*) as total_connections,
    ROUND(AVG(sbytes), 2) as avg_src_bytes,
    ROUND(STDDEV(sbytes), 2) as stddev_src_bytes,
    ROUND(MIN(sbytes), 2) as min_src_bytes,
    ROUND(MAX(sbytes), 2) as max_src_bytes,
    PERCENTILE(CAST(sbytes AS BIGINT), 0.5) as median_src_bytes,
    ROUND(AVG(dur), 4) as avg_duration,
    SUM(CASE WHEN label = 1 THEN 1 ELSE 0 END) as attack_count
FROM unsw_nb15
WHERE state IS NOT NULL AND state != '-'
GROUP BY state
HAVING total_connections > 100
ORDER BY attack_count DESC;
This finding indicates that attackers frequently exploit the connection establishment phase before connections are fully established, suggesting the importance of monitoring partial connection states in intrusion detection systems.
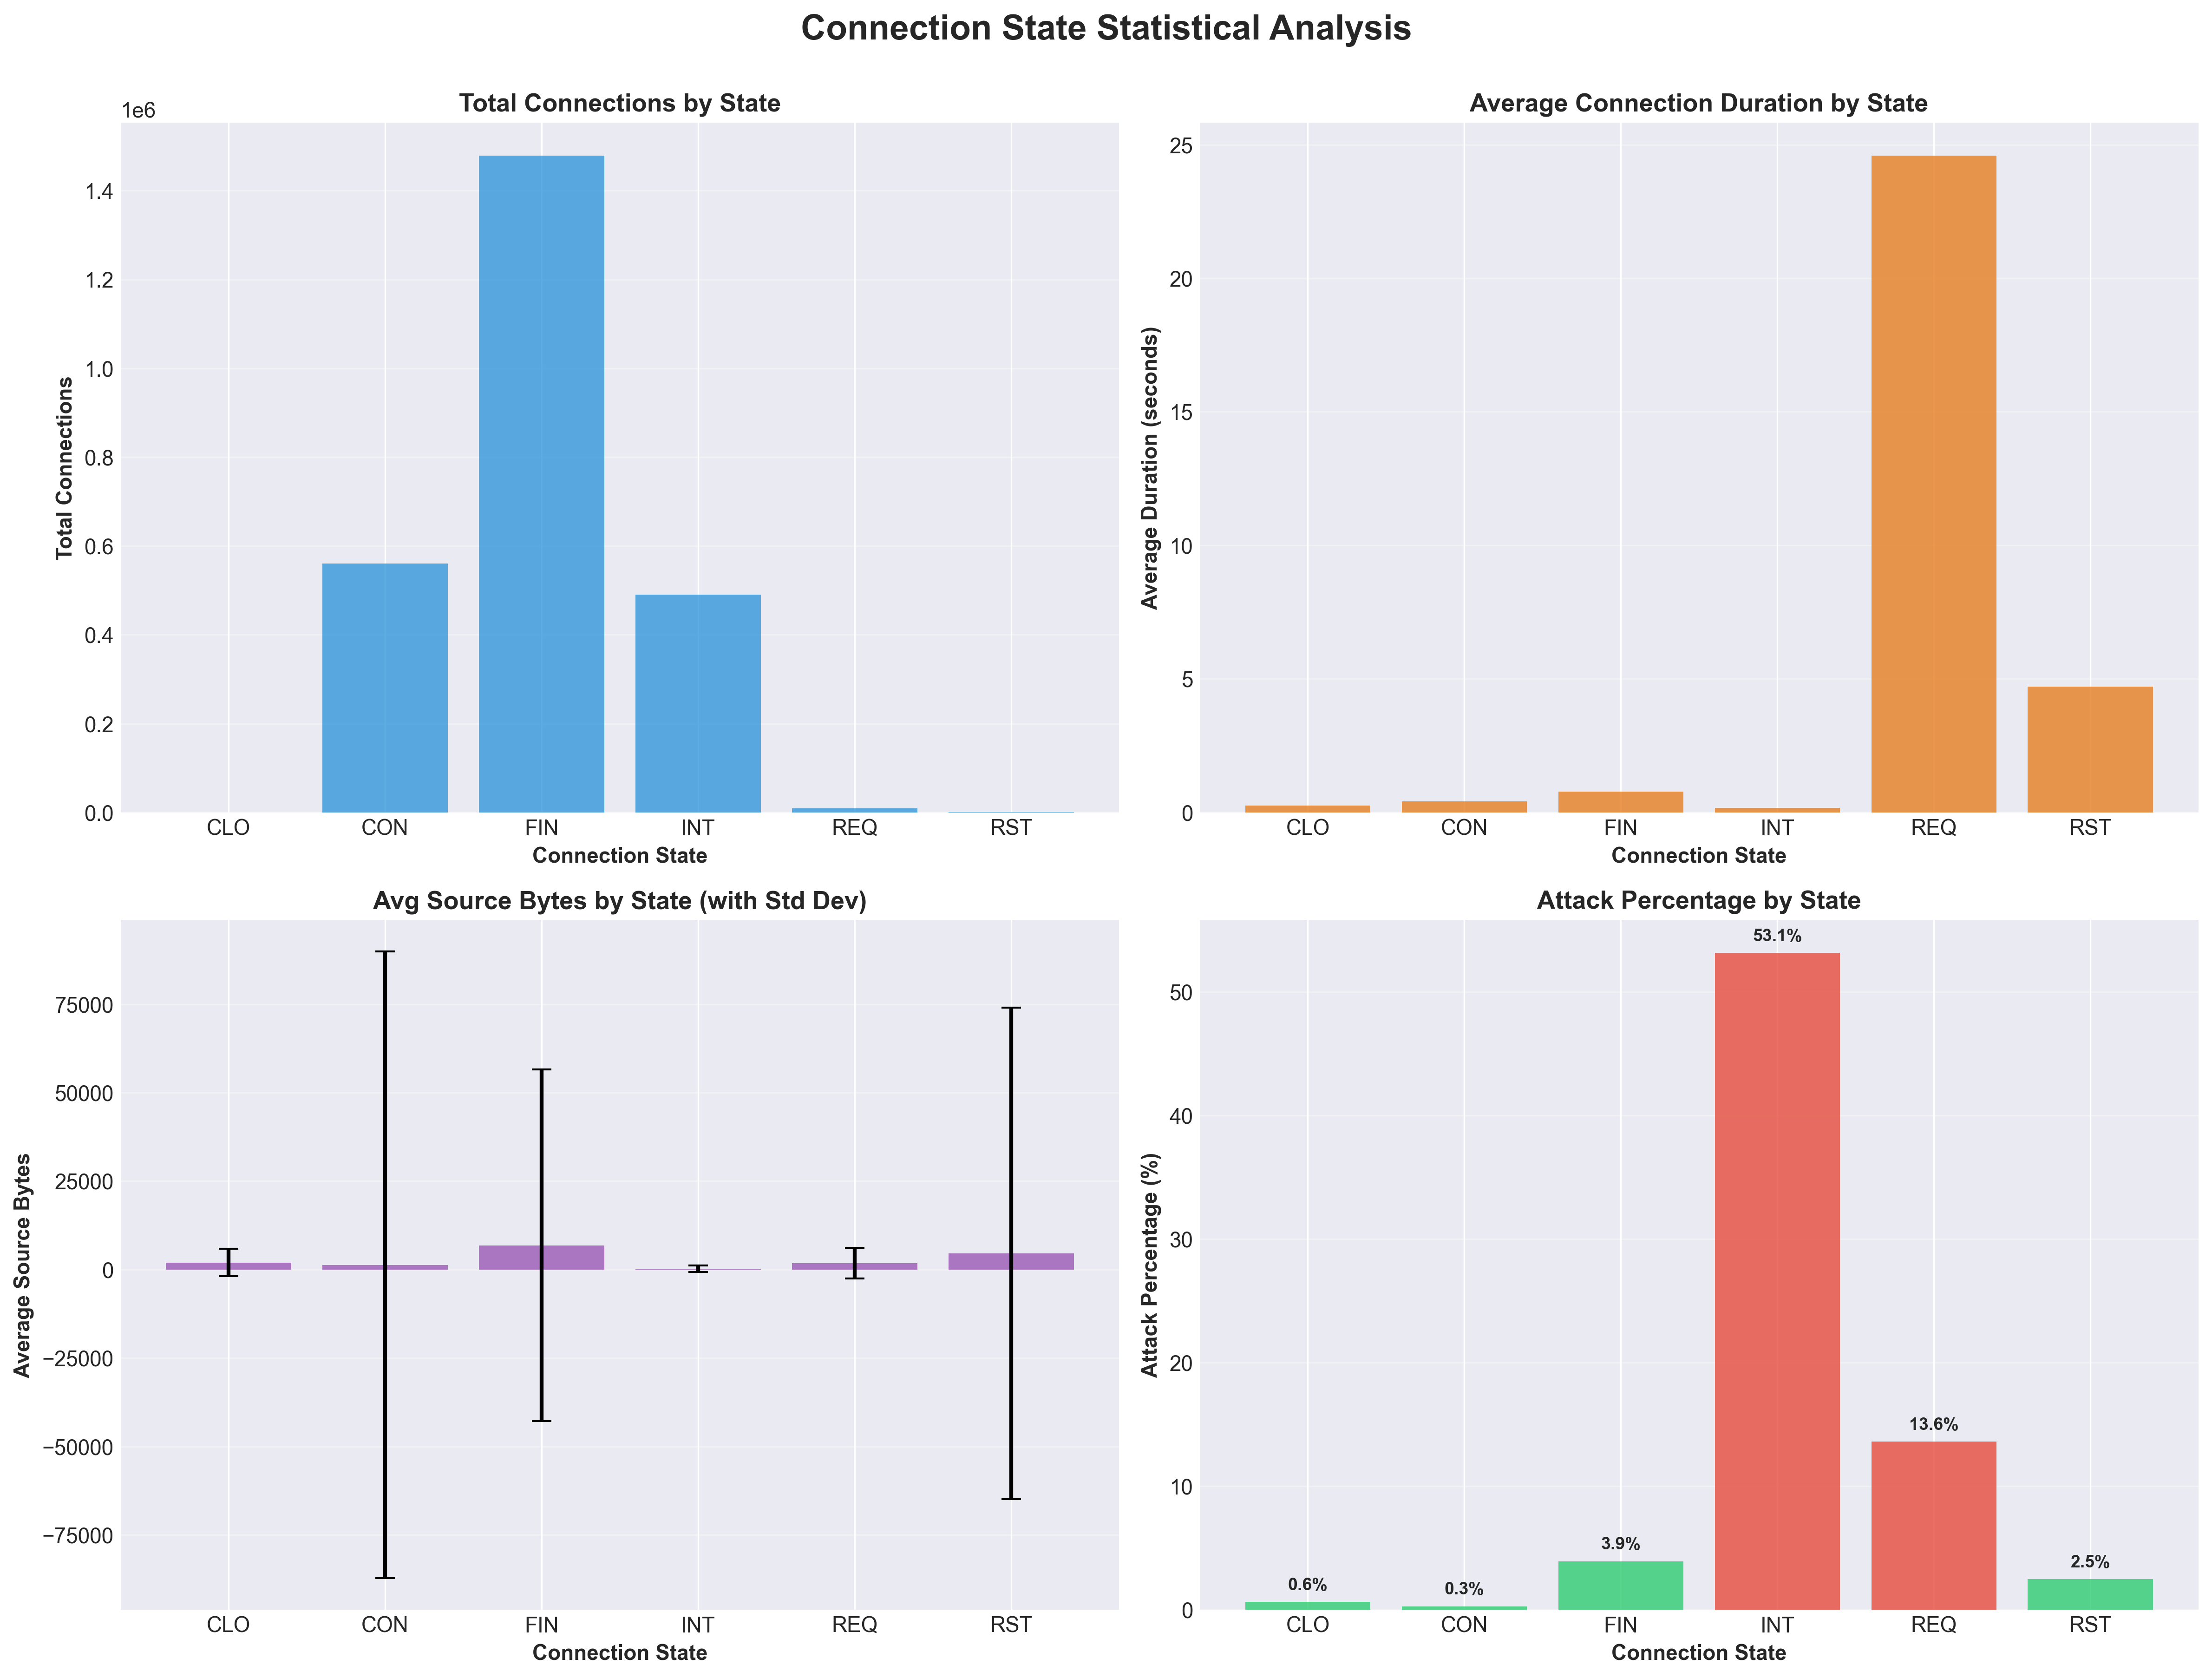
Multi-panel statistical analysis showing connection characteristics across different states
Part Two: Statistical Analysis with PySpark
After understanding the data through Hive queries, I moved to PySpark for more advanced statistical analysis. I implemented comprehensive exploratory data analysis including descriptive statistics, correlation analysis, and distribution comparisons.
View the complete statistical analysis script: pyspark_part1_statistical_analysis.py
Descriptive Statistics
I computed mean, standard deviation, minimum, and maximum values for 13 numerical features. The analysis revealed highly skewed distributions, with duration having a mean of 0.66 seconds but a standard deviation of 13.93 seconds. This extreme variance indicated that most connections are brief, but occasional very long sessions exist.
Correlation Analysis
I generated correlation matrices on a 10% stratified sample of the data. The analysis showed weak individual correlations between features and the attack label, with the highest correlation being only 0.19 for source TTL (sttl). This suggested that multivariate classification approaches would be necessary rather than relying on single features.
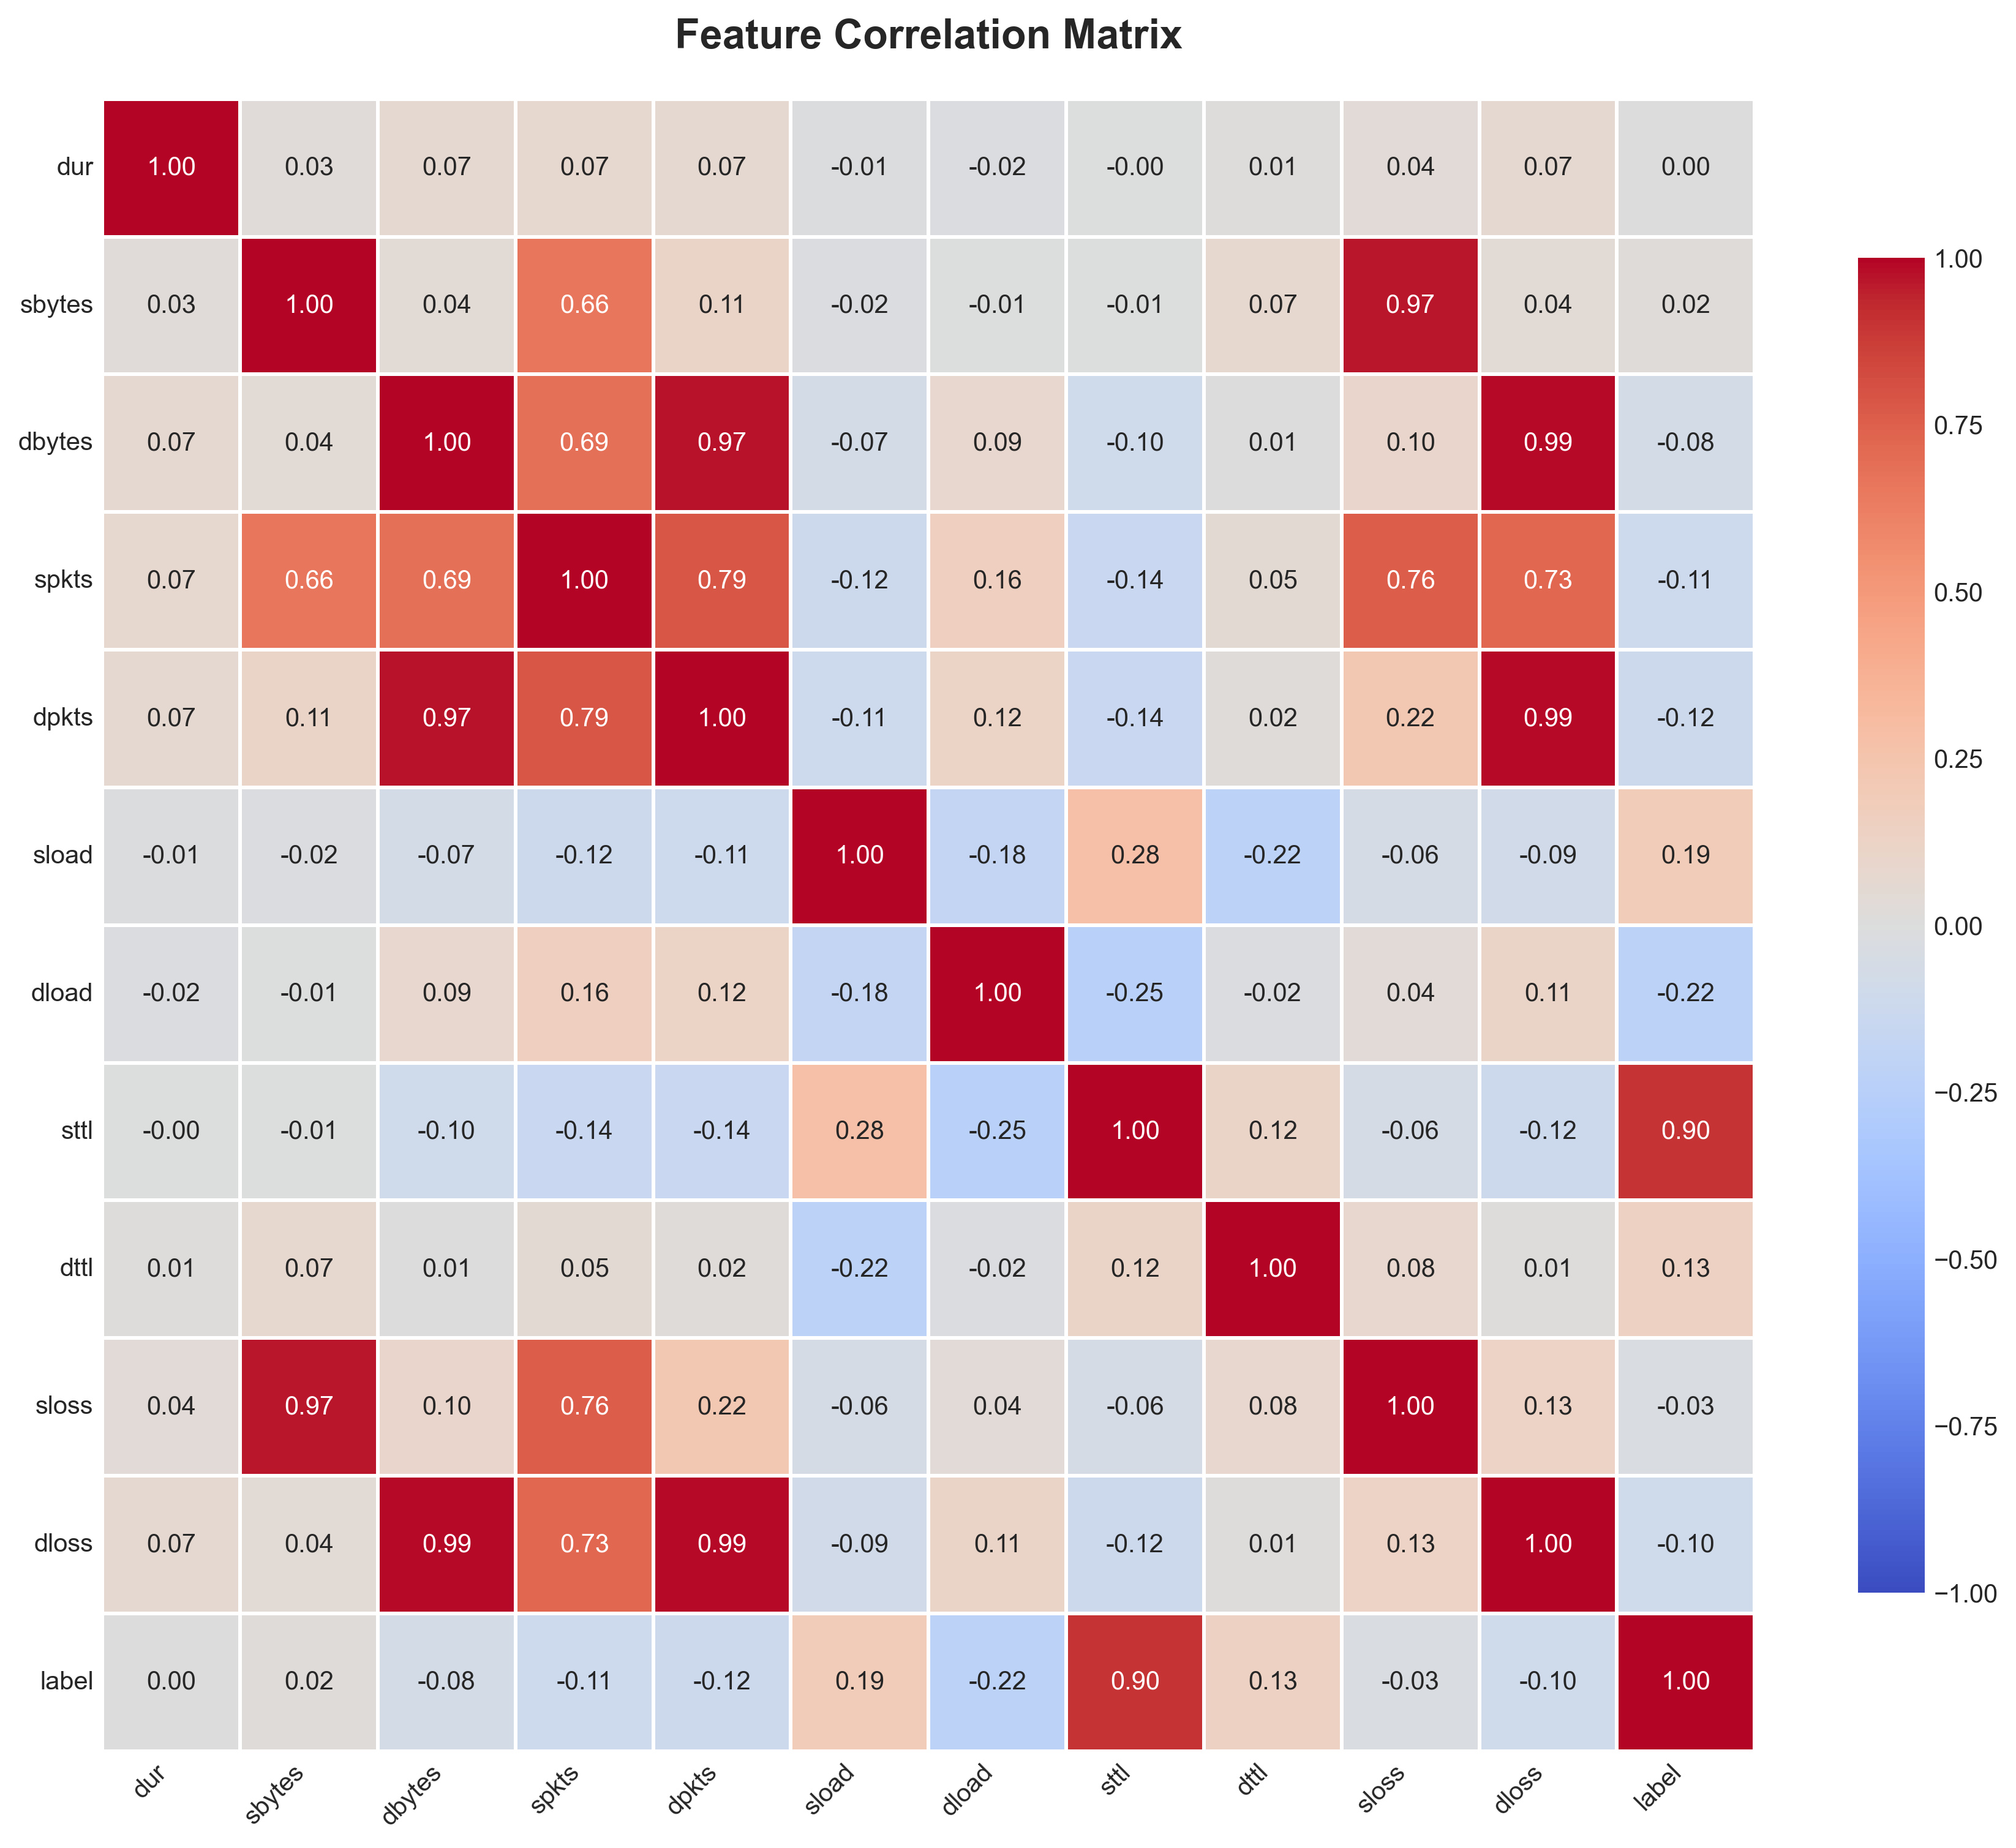
Correlation matrix revealing weak individual but strong multivariate relationships
Distribution Analysis
I created histograms comparing feature distributions between normal and attack traffic. The visualizations showed distinct patterns: attacks were concentrated at short durations with higher transfer rates, while normal traffic exhibited more diverse patterns.
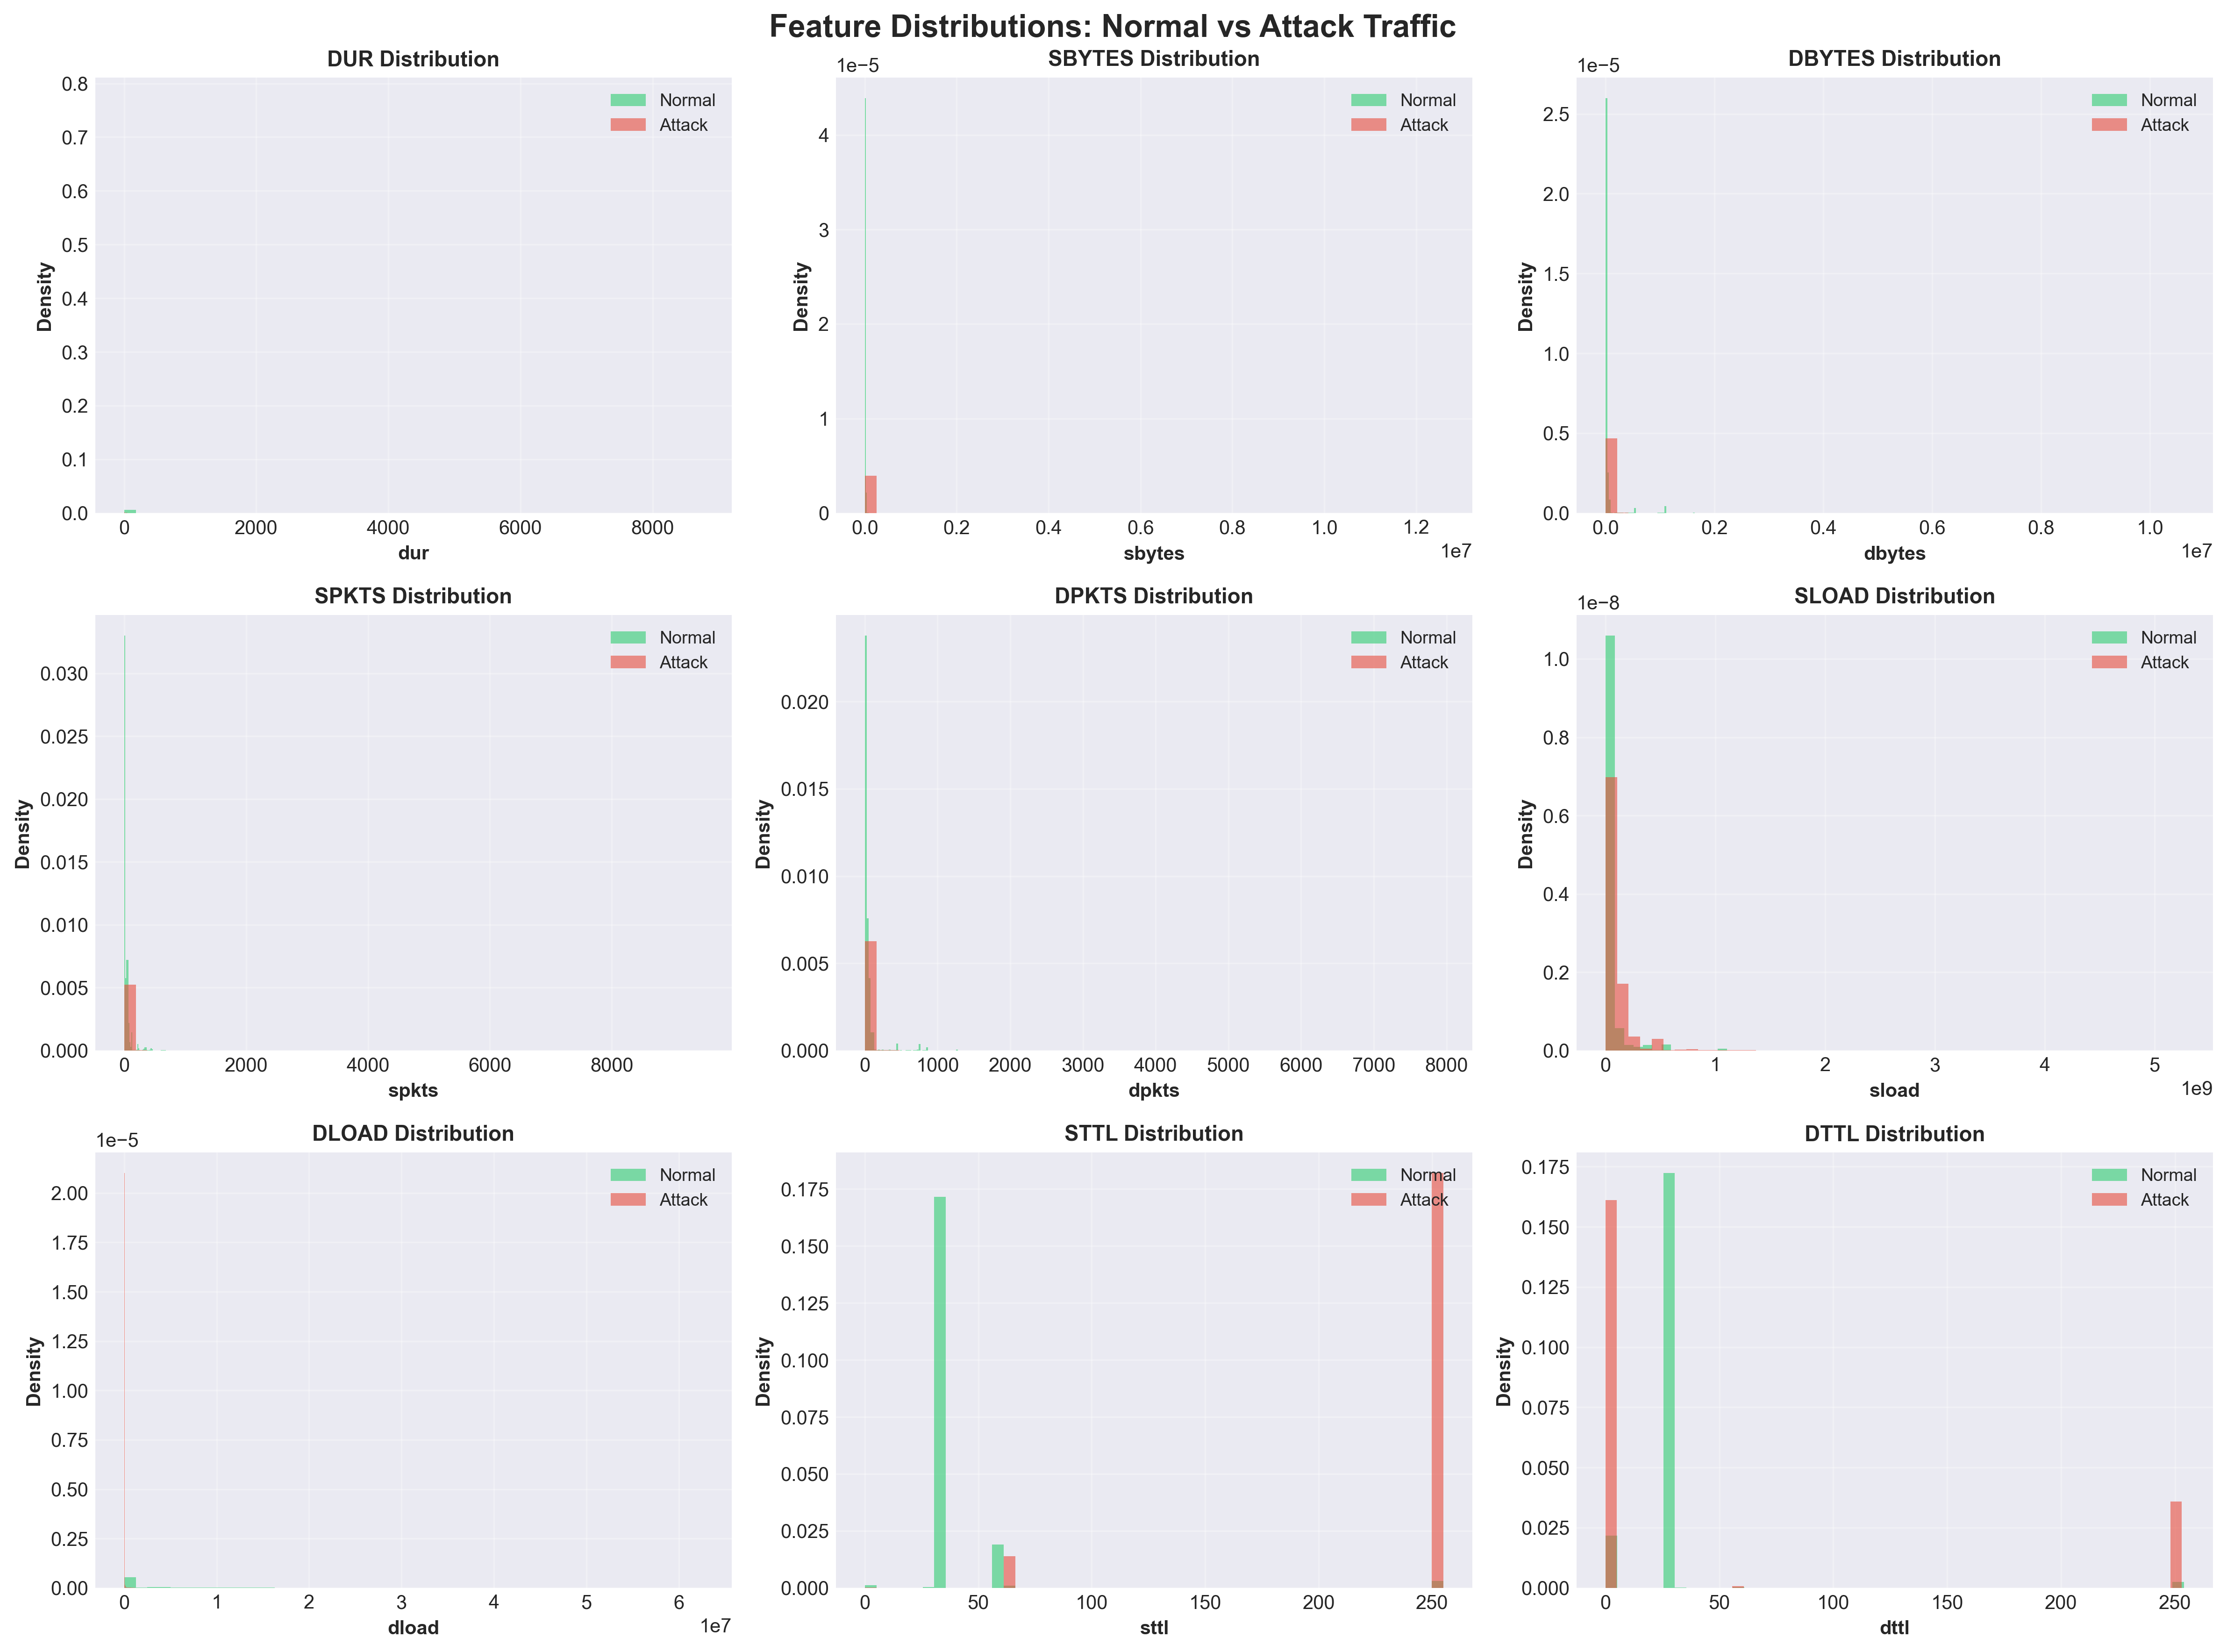
Distribution comparison showing distinct patterns between normal and attack traffic
Part Three: Binary Classification with Random Forest
With a solid understanding of the data, I implemented a Random Forest classifier for binary classification to distinguish normal traffic from attacks. I selected 26 features based on data quality and relevance, excluding categorical features that would require encoding.
View the complete binary classification script: pyspark_part2_binary_classification.py
Model Configuration
- Algorithm: Random Forest
- Number of trees: 100
- Maximum depth: 10
- Features: 26 selected features
- Train/Test split: 70/30 (1,778,139 training records, 761,600 test records)
Exceptional Performance Results
The model achieved near-perfect classification performance that exceeded my expectations:
| Metric | Value |
|---|---|
| Accuracy | 99.07% |
| AUC-ROC | 99.95% |
| F1-Score | 99.08% |
| Precision | 99.09% |
| Recall | 99.07% |
| False Positive Rate | 0.68% |
| Attack Detection Rate | 97.39% |
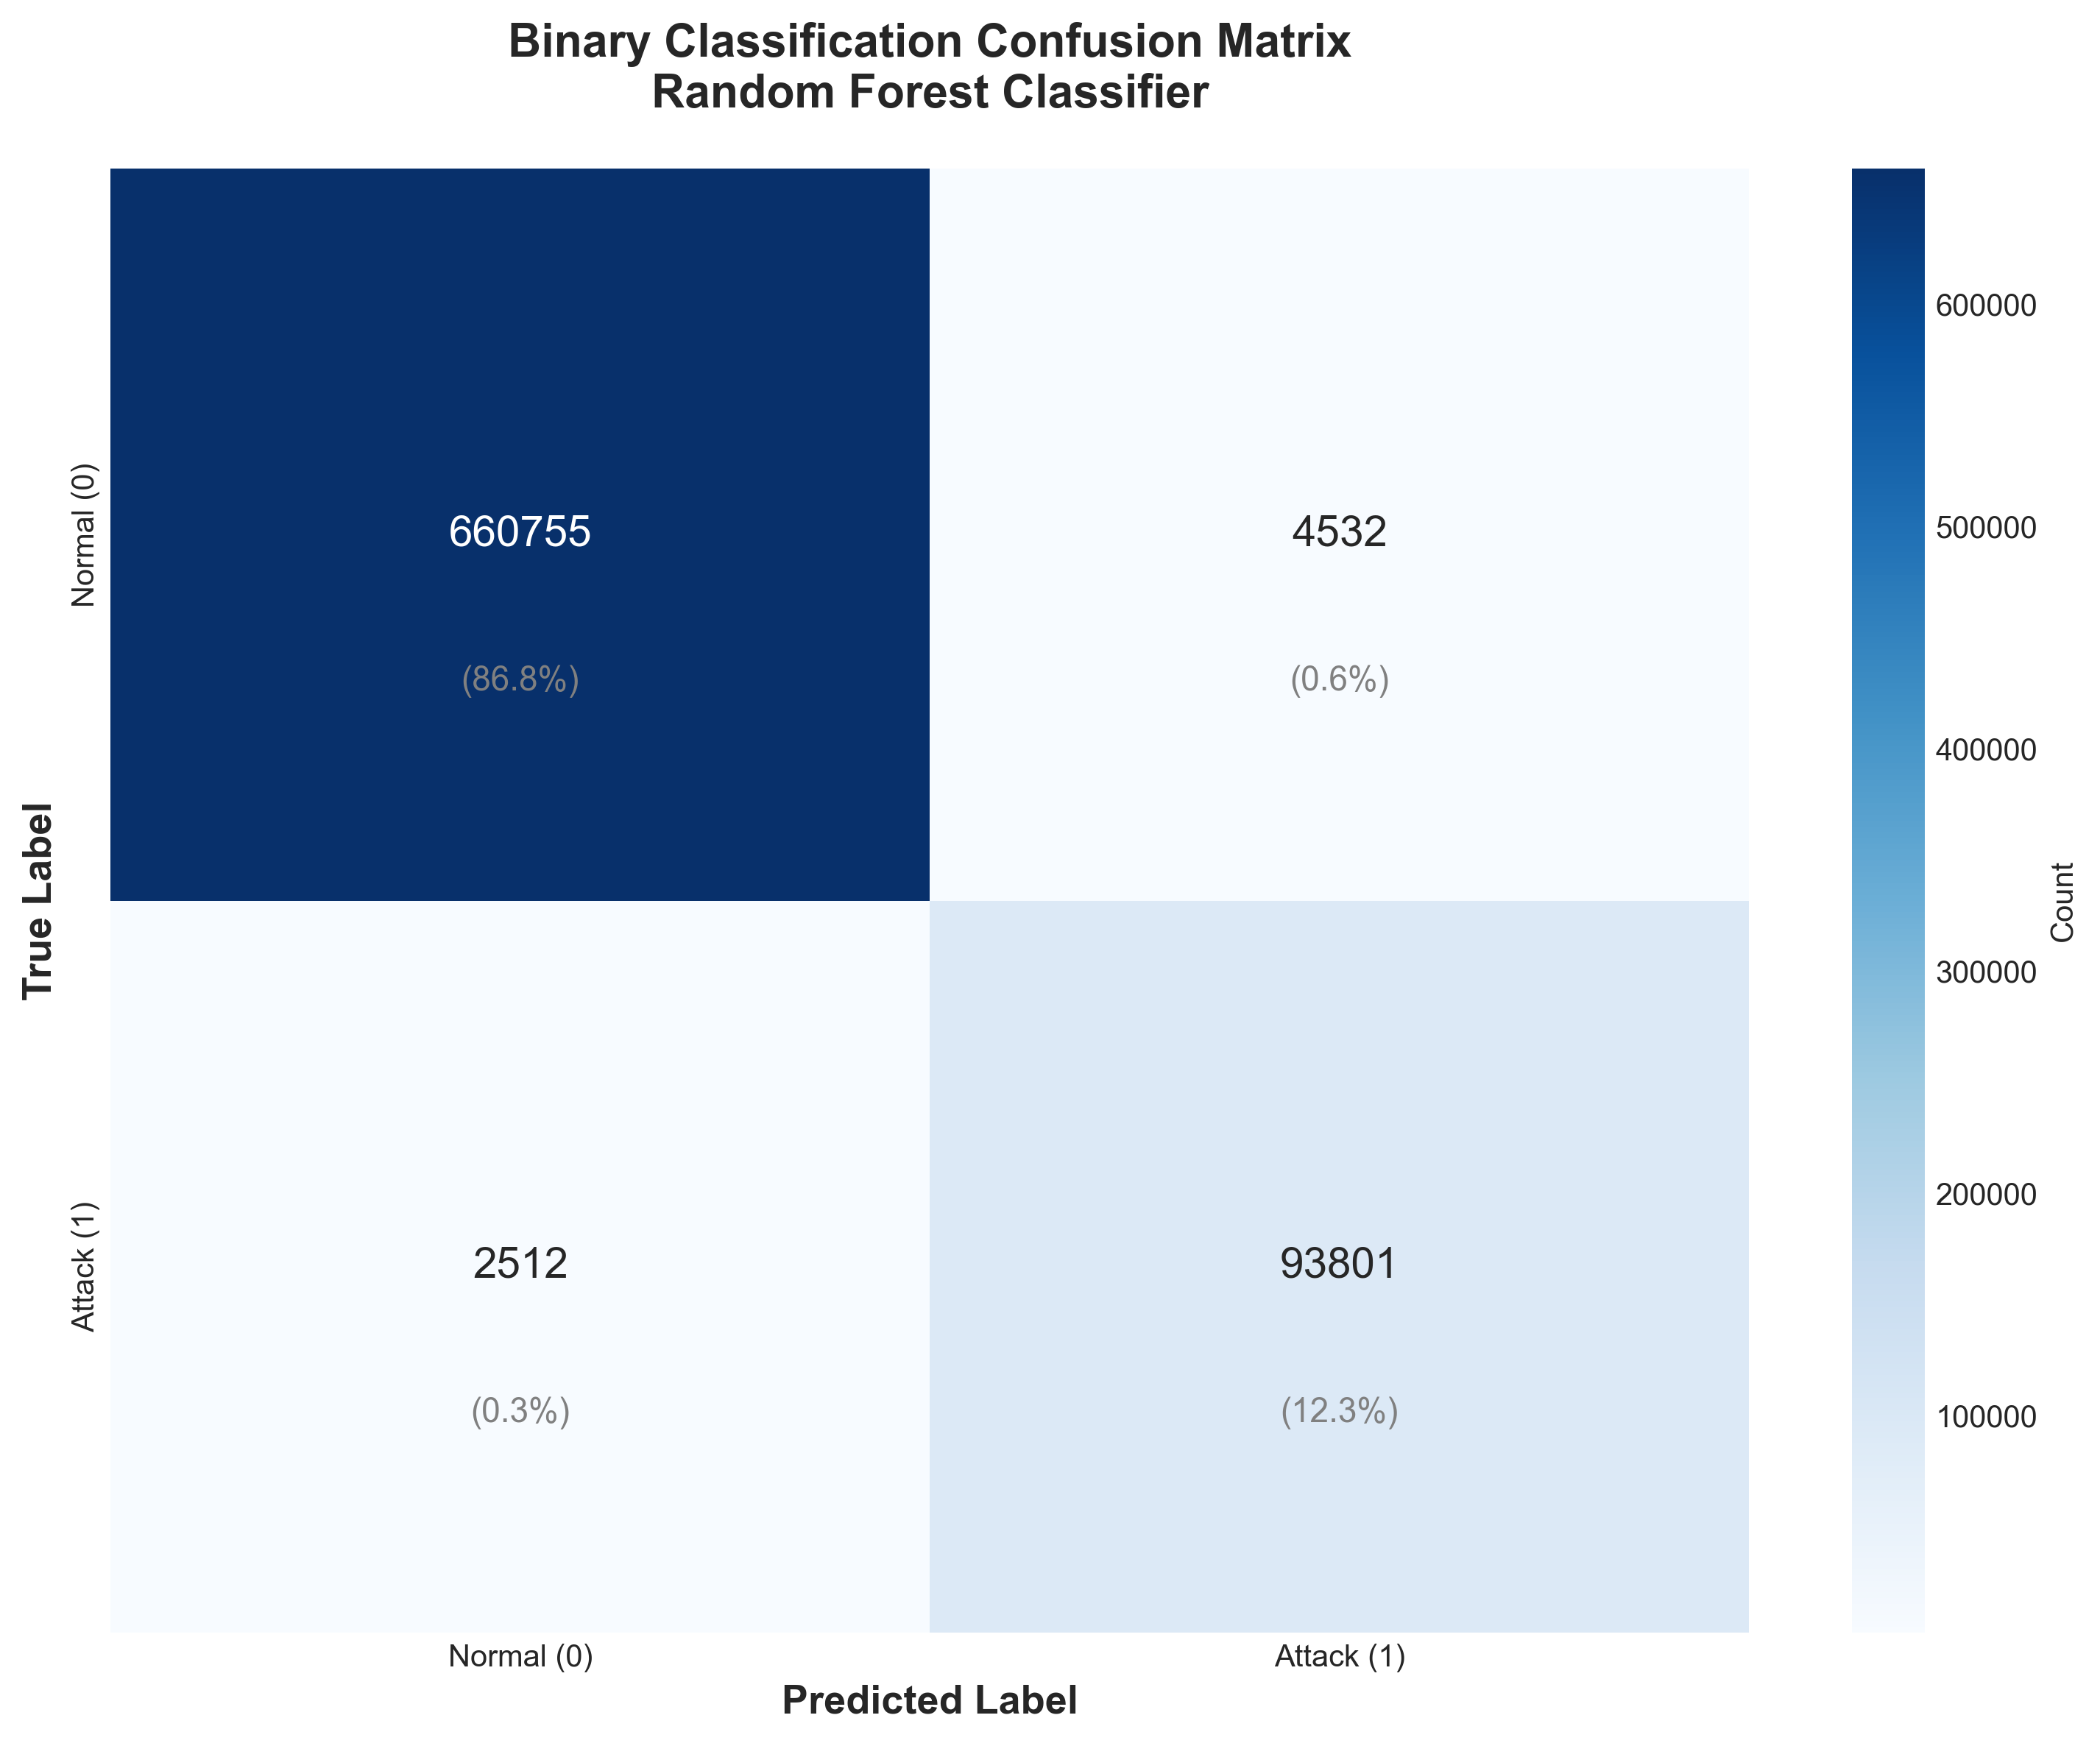
Confusion matrix demonstrating the accuracy with minimal misclassifications
The confusion matrix revealed 660,755 true negatives and 93,801 true positives, with only 4,532 false positives and 2,512 false negatives. In security contexts, false negatives are particularly concerning as they represent undetected attacks, making the 97.39% attack detection rate highly satisfactory.
ROC Curve Analysis
The ROC curve demonstrated the model's exceptional discriminative ability. With an AUC-ROC score of 0.9995 approaching the theoretical maximum of 1.0, the curve hugs the top-left corner, indicating the model achieves high true positive rates even at very low false positive rates.
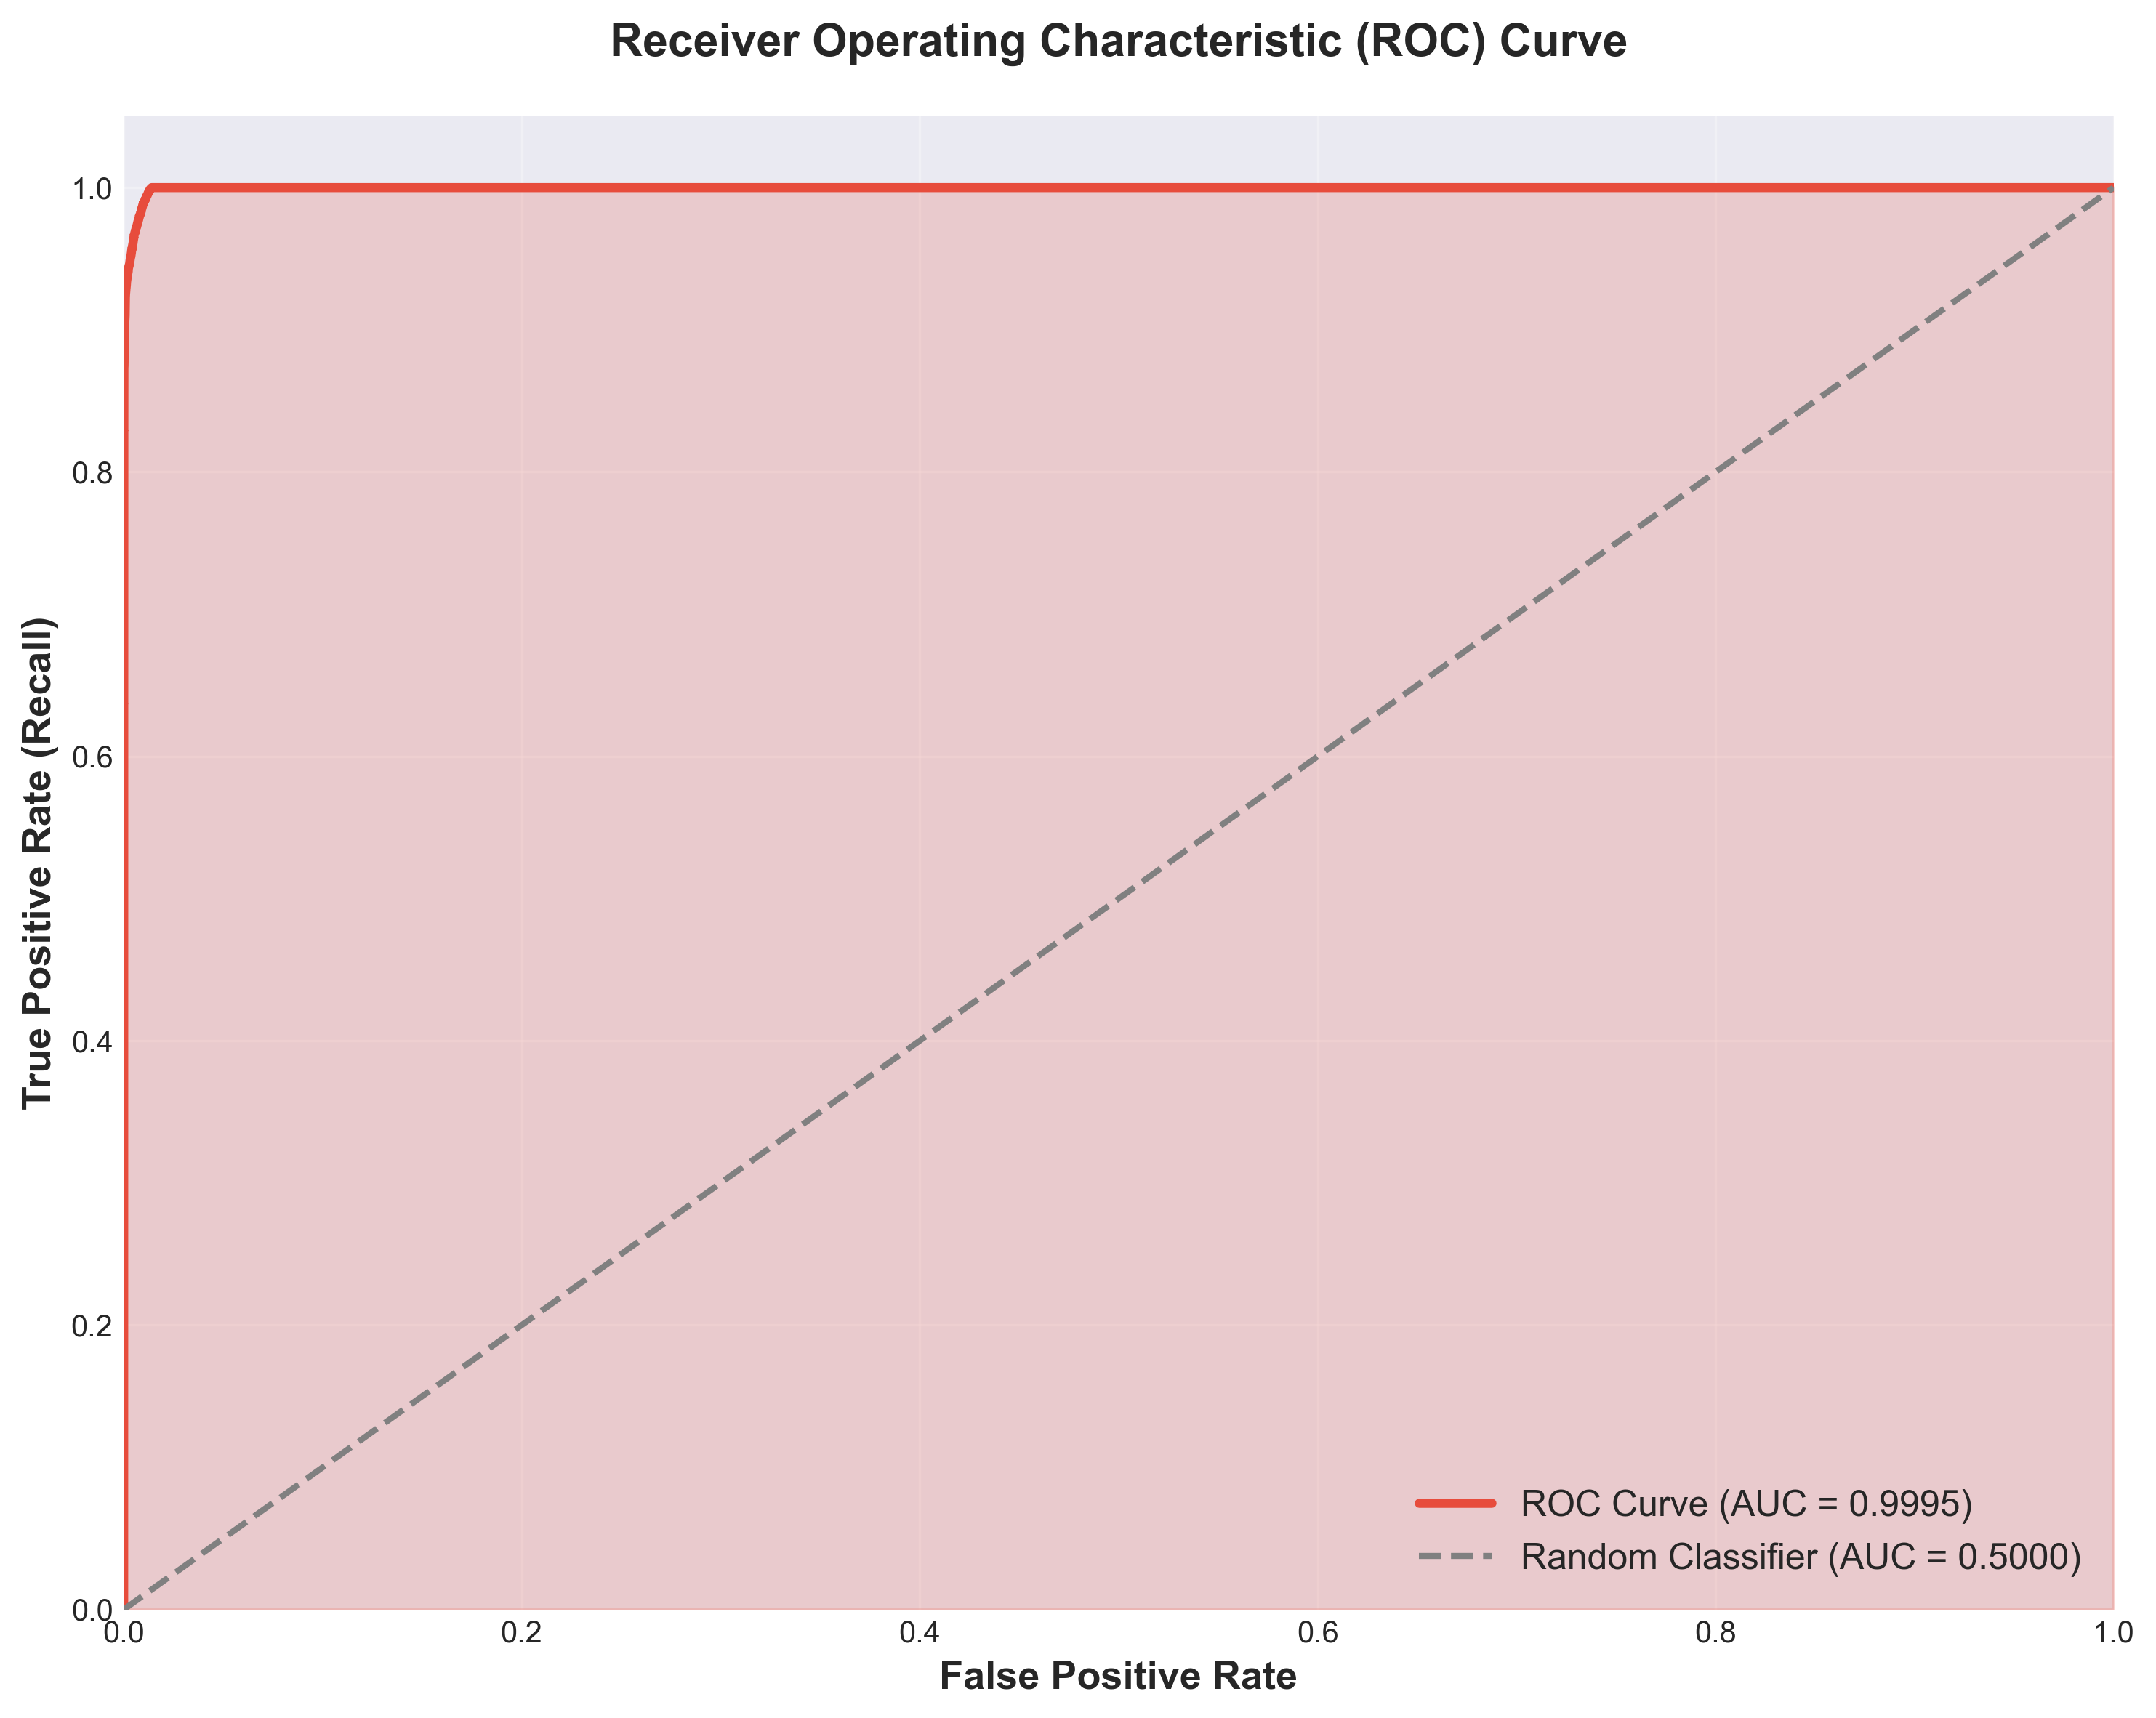
ROC curve showing AUC of 0.9995, approaching theoretical maximum performance
Feature Importance Discovery
One of the most interesting findings came from analyzing feature importance. I discovered that connection pattern features dominated the importance rankings, accounting for over 33% of total feature importance.
Top 5 Most Important Features:
- ct_state_ttl (33.52%): Connection patterns with similar state and TTL
- sttl (20.95%): Source time-to-live value
- sbytes (9.61%): Source bytes transferred
- dmeansz (8.57%): Mean destination packet size
- smeansz (5.36%): Mean source packet size
This suggests that attackers exhibit characteristic behavioral patterns in how they establish connections rather than simply transmitting unusual volumes or types of data. This insight has significant implications for intrusion detection system design.
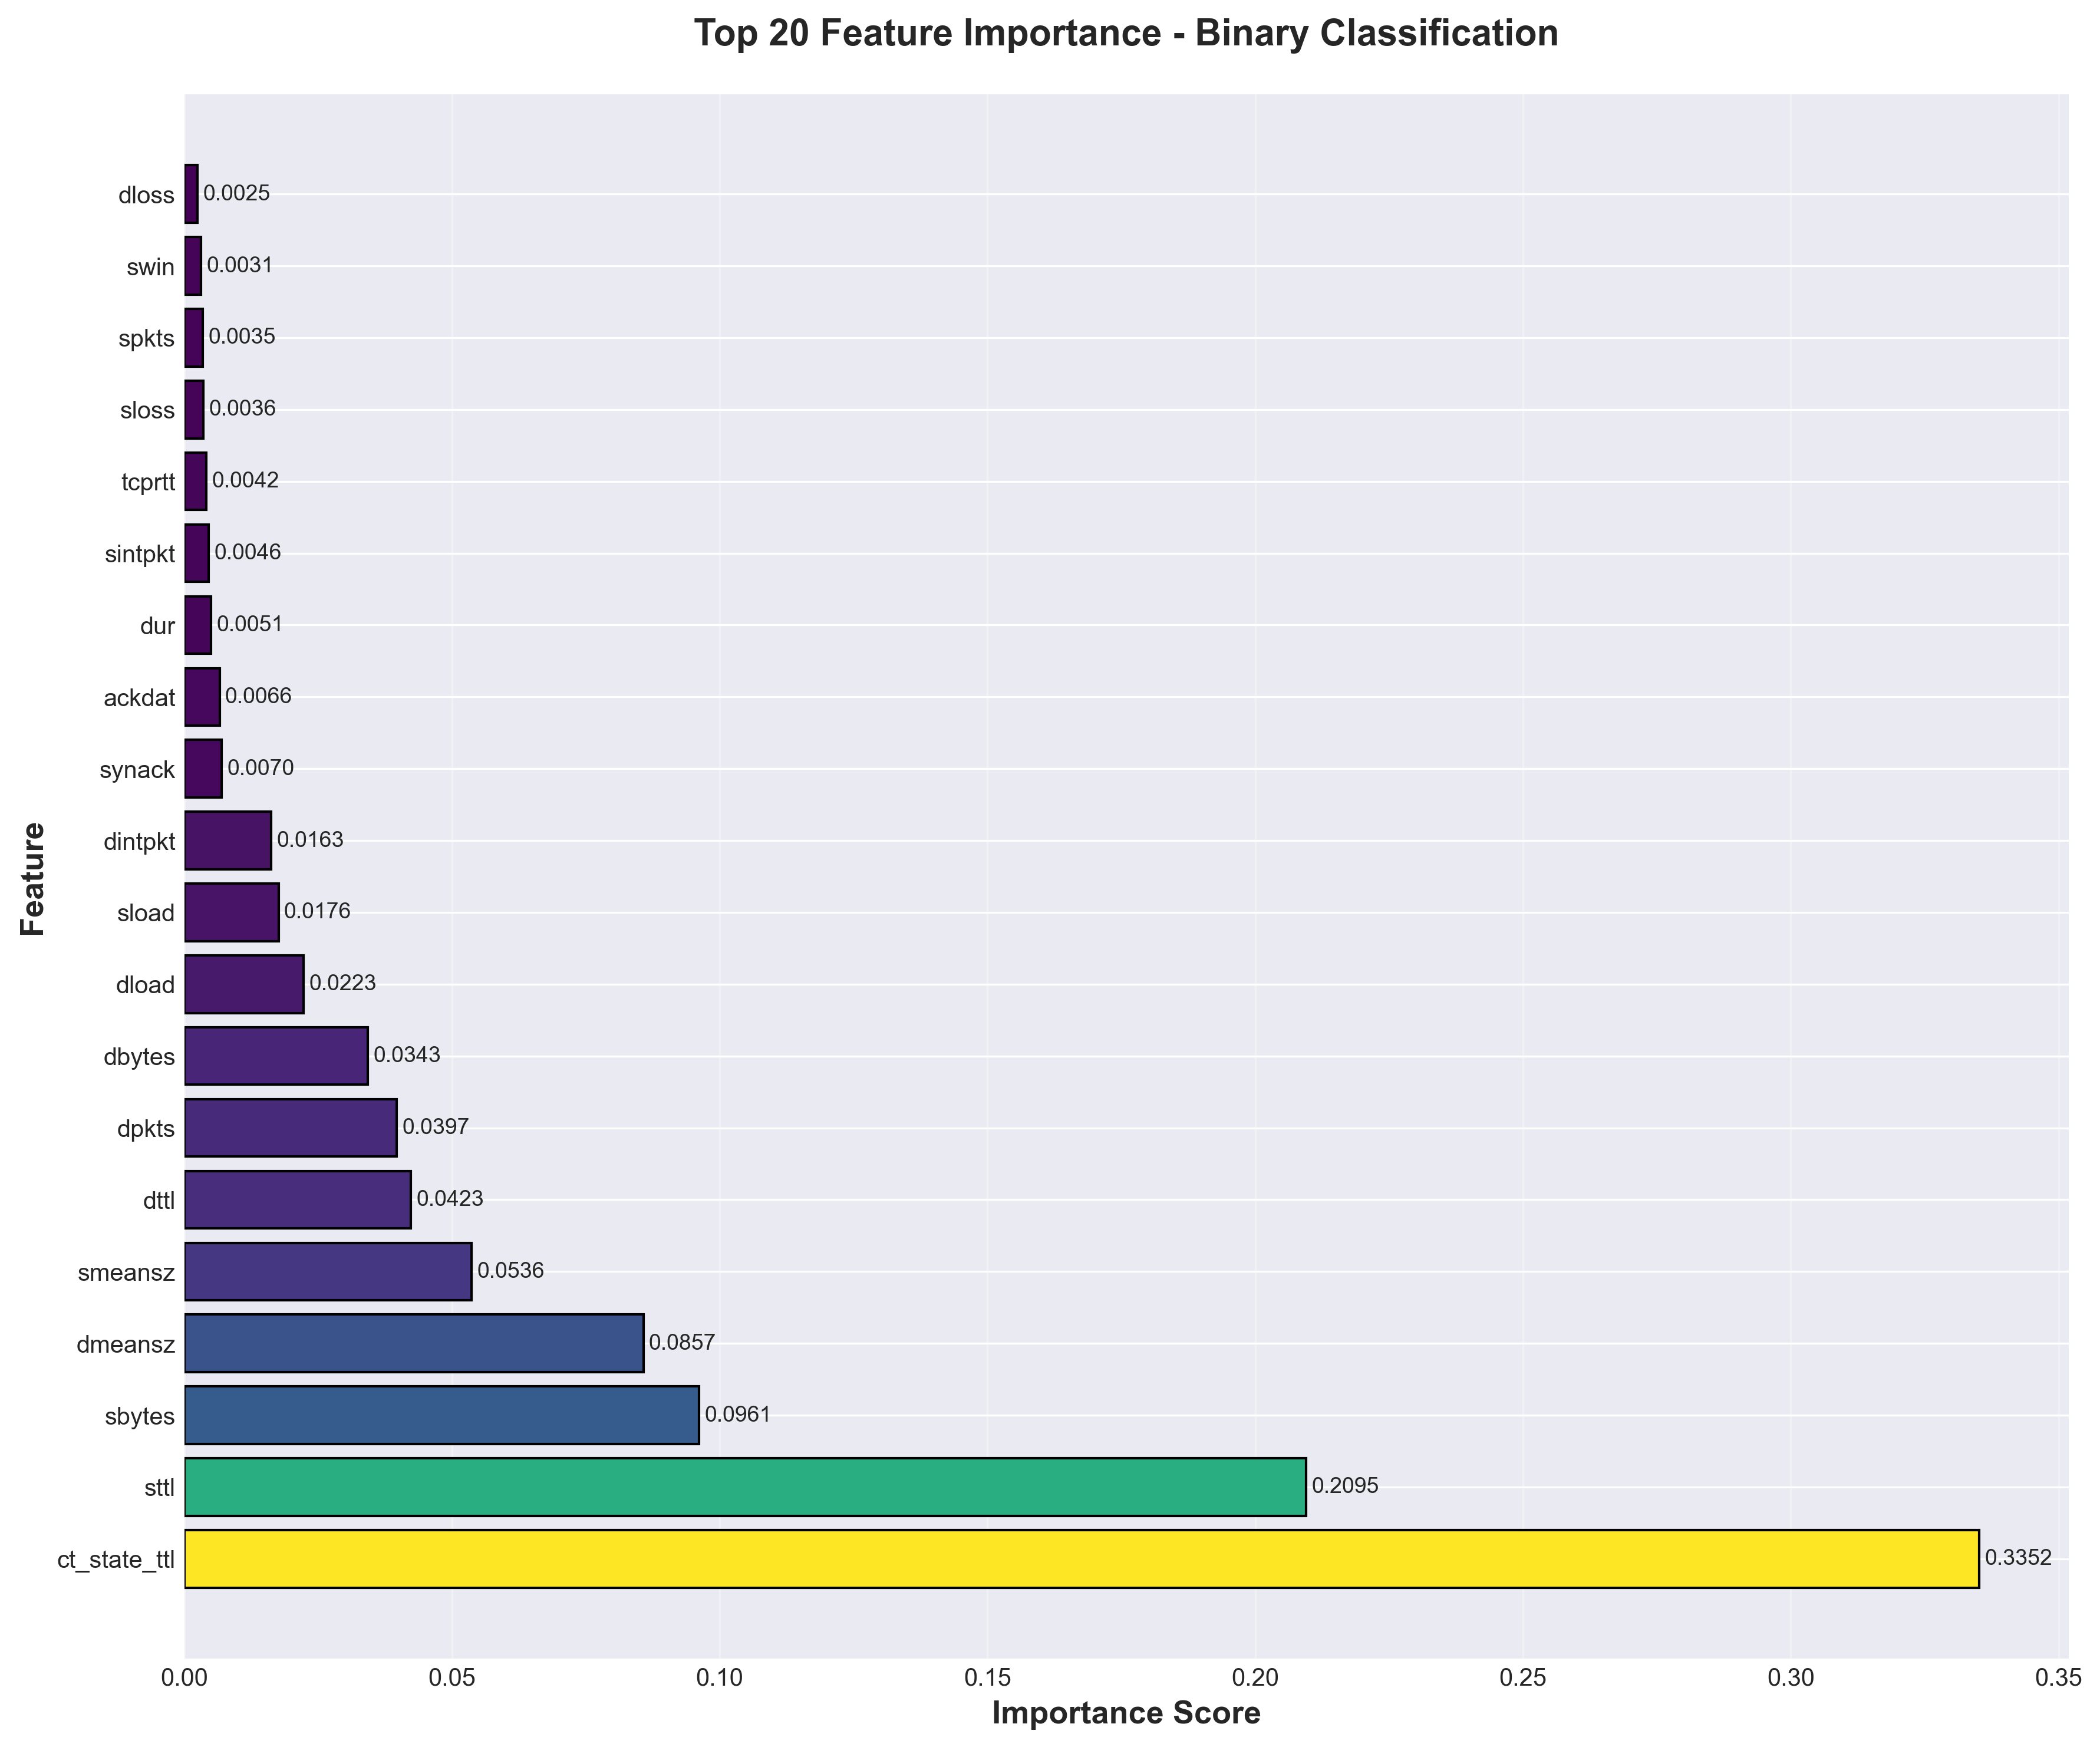
Top 20 features ranked by importance showing dominance of connection pattern features
Part Four: Multi-class Attack Type Identification
Building on the binary classification success, I extended the analysis to multi-class classification to identify specific attack types. This proved more challenging due to severe class imbalance within attack categories.
View the complete multi-class classification script: pyspark_part3_multiclass_classification.py
The Class Imbalance Challenge
The dataset contained 11 categories (after cleaning and standardizing), ranging from Normal traffic with 2,218,456 instances down to Worms with only 174 instances. This extreme imbalance presented a significant challenge for the classification model.
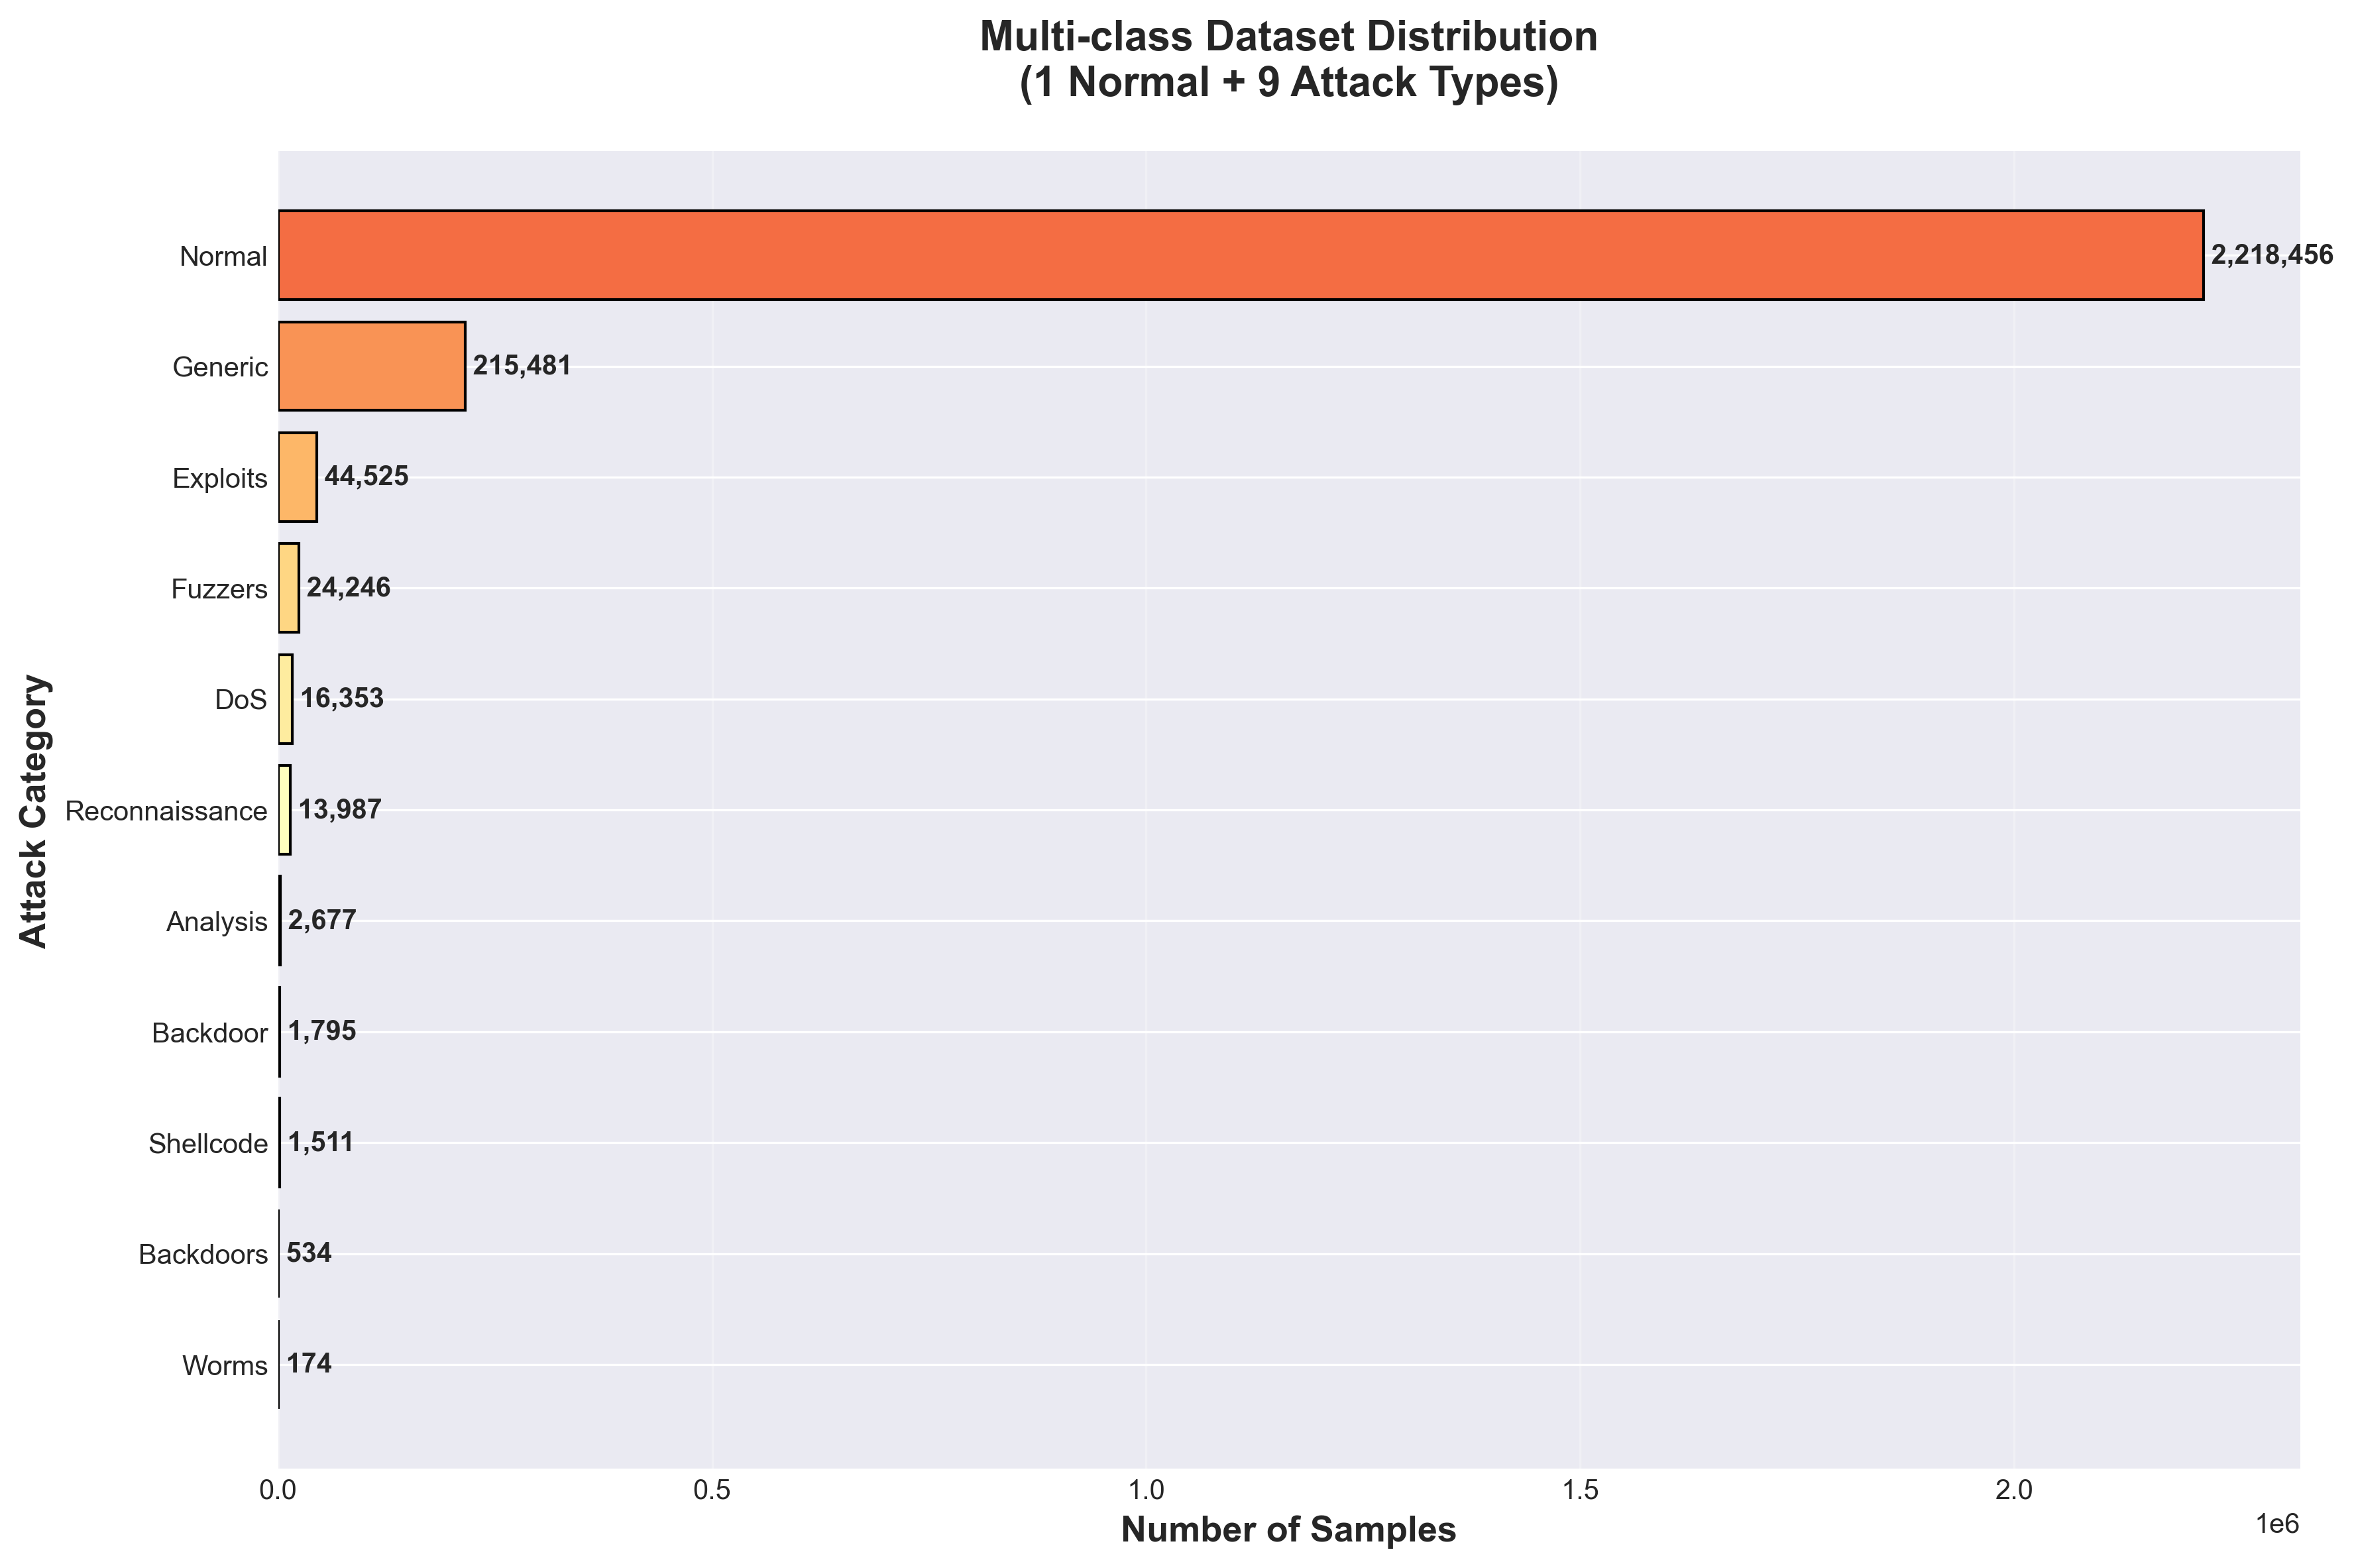
Multi-class dataset distribution showing severe imbalance across the categories
Model Performance
Despite the challenges, the Random Forest classifier achieved strong overall performance with 97.79% accuracy and a weighted F1-score of 97.33%. However, performance varied substantially across different attack types.
Performance by Class Category:
- High Performance (F1 > 0.95): Normal traffic (F1=0.99), Generic attacks (F1=0.99), Exploits (F1=0.70)
- Moderate Performance (F1: 0.40-0.85): Reconnaissance (F1=0.81), Fuzzers (F1=0.40)
- Challenging (F1 < 0.05): Worms (F1=0.26), Shellcode (F1=0.00), Backdoors (F1=0.00), DoS (F1=0.04), Analysis (F1=0.01)
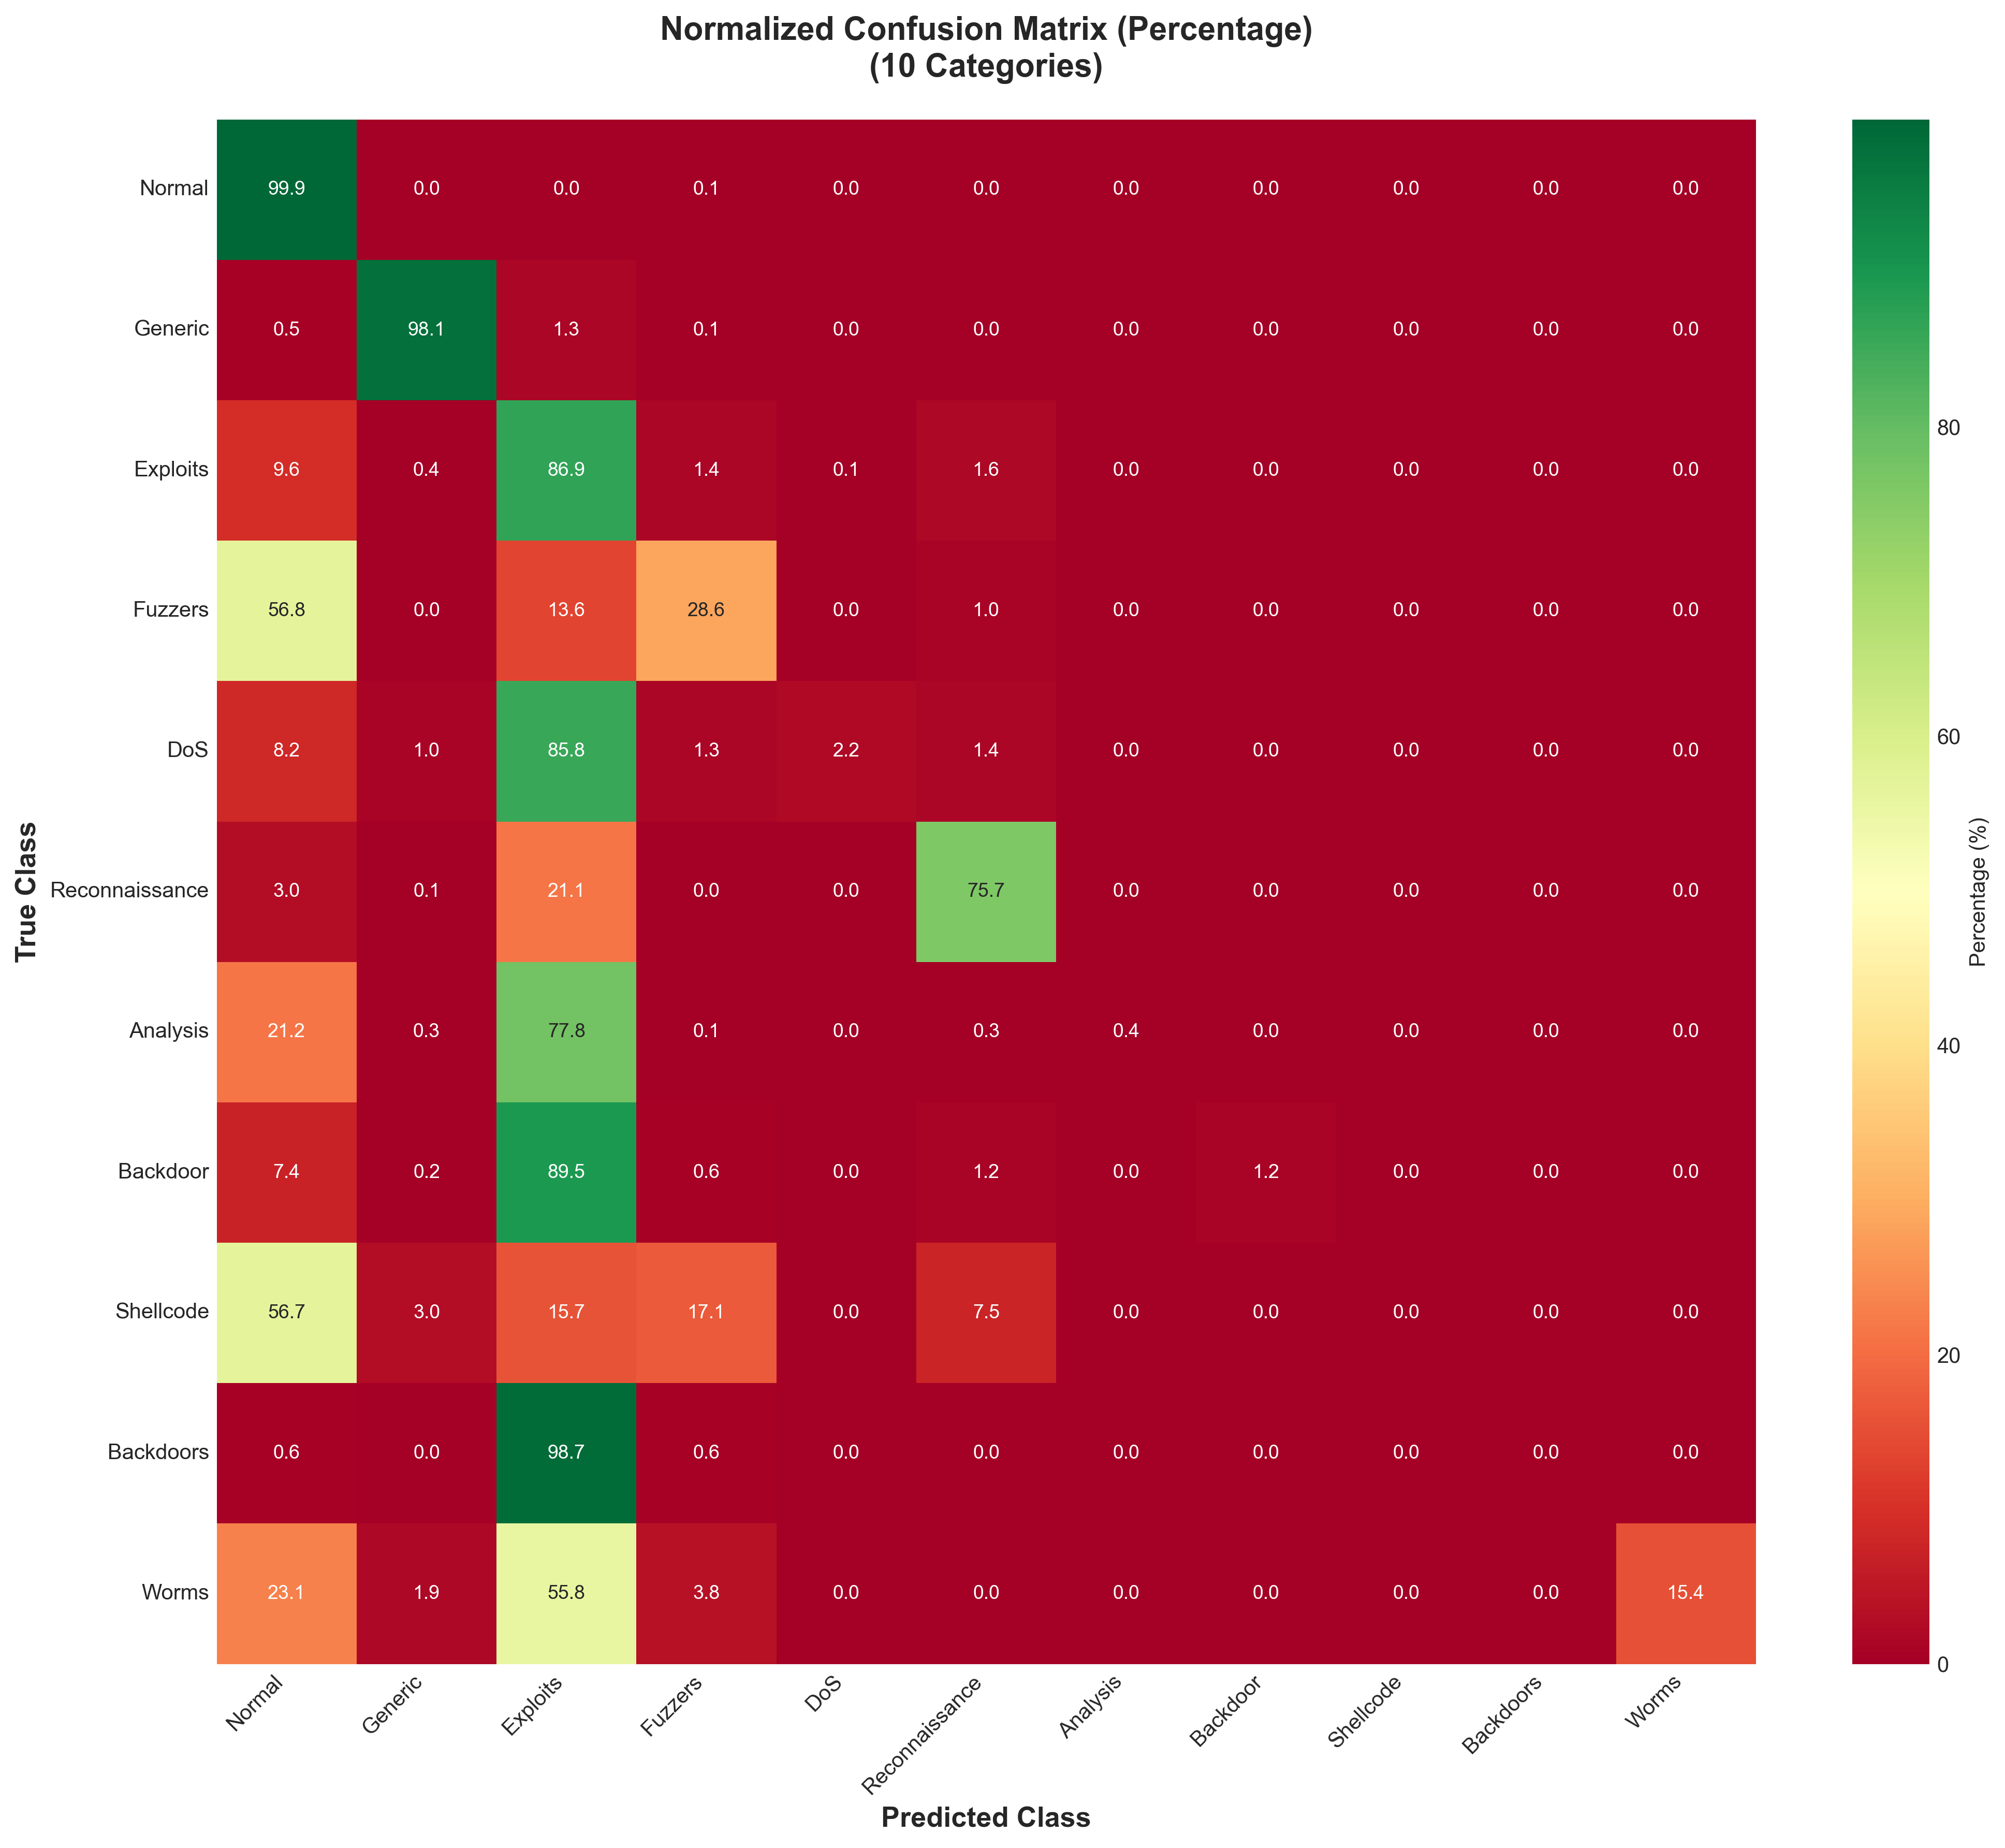
Normalized confusion matrix showing per-class accuracy percentages across the categories
The normalized confusion matrix revealed that Normal traffic achieved over 99% classification accuracy, while rare attack types showed more substantial confusion with other categories. This pattern was expected given the limited training examples for rare classes.
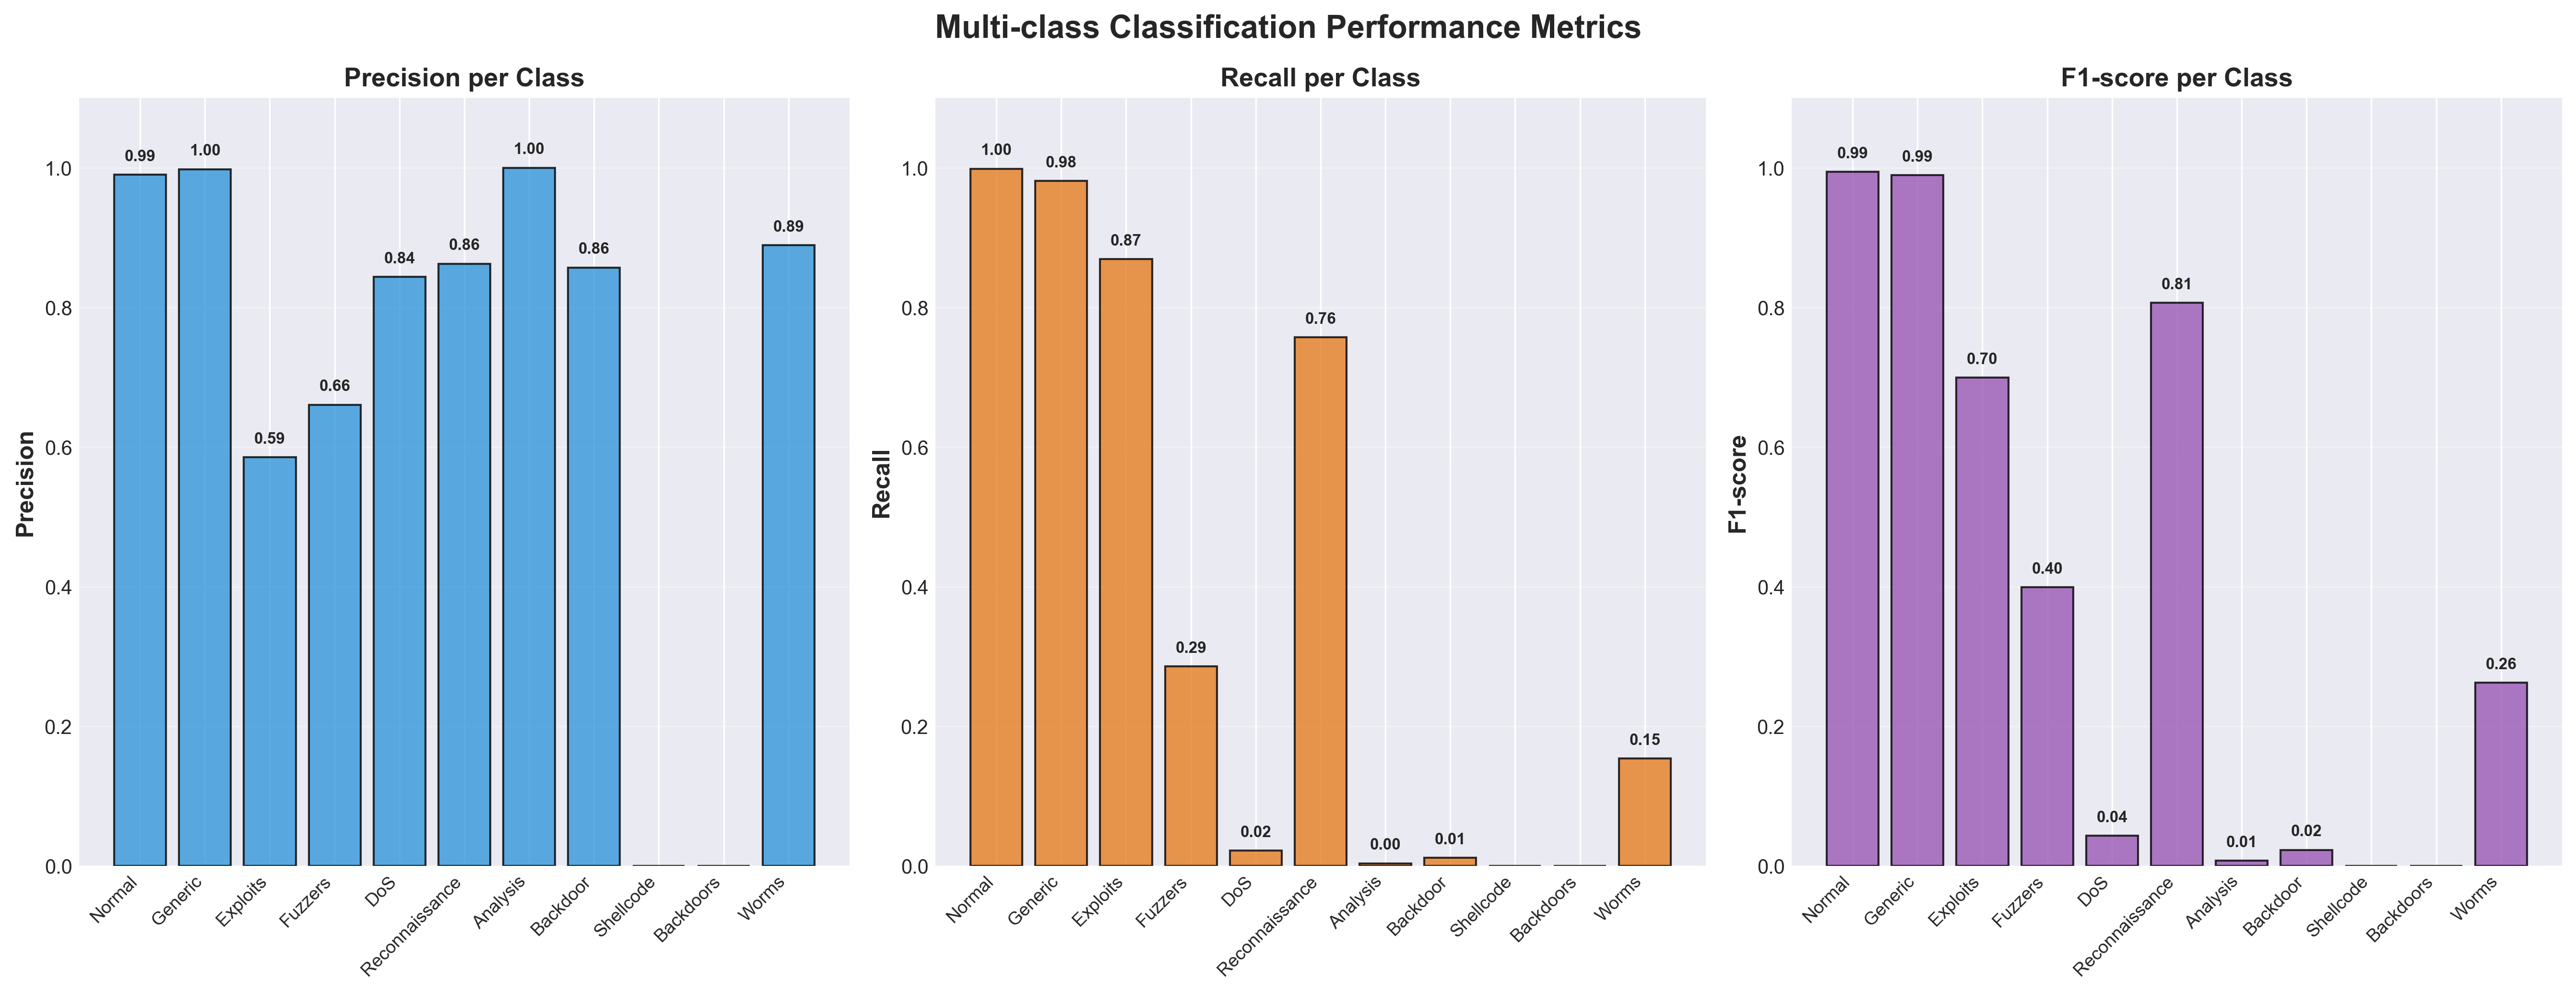
Precision, Recall, and F1-Score breakdown for each attack category
Key Insights and Lessons Learned
1. Behavioral Analysis Trumps Packet Statistics
The most surprising discovery was that connection pattern features proved far more discriminative than traditional packet-level statistics. The ct_state_ttl feature alone contributed 33.52% to the model's decision-making in binary classification and 26.47% in multi-class classification. Therefore, this suggests that monitoring how attackers interact with systems over time is more effective than analyzing individual packet characteristics.
2. Protocol-Specific Vulnerabilities Require Attention
The Hive analysis revealed specific protocol-service combinations with disproportionately high attack rates. Organizations should prioritize monitoring and securing these vulnerable combinations, particularly TCP/POP3 (99.74% attack rate) and UDP/DNS services (26.94% attack rate with 210,566 malicious connections).
3. Class Imbalance Affects Different Tasks Differently
While binary classification handled class imbalance exceptionally well (99.07% accuracy), multi-class classification showed clear performance degradation for rare attack types. Categories with fewer than 2,000 instances (Analysis, Backdoor, Shellcode, Backdoors, Worms) achieved F1-scores below 0.30. This shows that production systems need specialized techniques such as SMOTE oversampling or class-weighted loss functions for comprehensive attack detection.
4. Connection State Monitoring is Critical
The discovery that 53.14% of intermediate (INT) connection states are malicious highlights a critical security blind spot. Traditional firewalls focus on established connections, but attackers are exploiting the connection establishment phase, so yes, security teams should implement enhanced monitoring of partial connection states.